
- KPI – April 2025: The Brief
- KPI – April 2025: Recent Vehicle Recalls
- KPI – April 2025: State of Business – Automotive Industry
- KPI – April 2025: State of Manufacturing
- KPI – April 2025: Consumer Trends
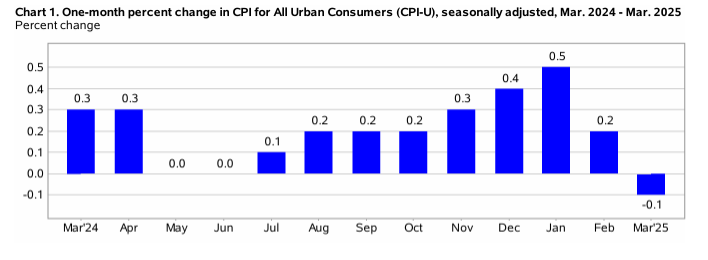
In March, the Consumer Price Index for All Urban Consumers (CPI-U) decreased 0.1% on a seasonally adjusted basis after rising 0.2% in February, according to the U.S. Bureau of Labor Statistics. Over the last 12 months, the all-items index increased 2.4% before seasonal adjustment.
Important takeaways, courtesy of the U.S. Bureau of Labor Statistics:
- The index for energy fell 2.4% in March, as a 6.3% decline in the index for gasoline more than offset increases in the indexes for electricity and natural gas. On the contrary, the food index rose 0.4%, with the food-at-home index increasing 0.5% and the food-away-from-home index rising 0.4% month-over-month.
- Indexes on the rise include personal care, medical care, education, apparel and new vehicles. The indexes for airline fares, motor vehicle insurance, used cars and trucks, as well as recreation were among the major indexes to decrease.
- The all-items index rose 2.4% year-over-year. The all items less food and energy index registered 2.8% over the last 12 months – the smallest 12-month increase since March 2021. The energy index decreased 3.3% year-over-year, while the food index increased 3% over the last year.
Employment
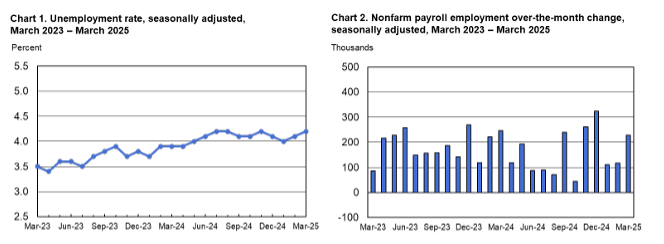
Total nonfarm payroll employment rose by 228,000 in March – exceeding the Dow Jones estimate of 140,000. In addition, private sector payrolls added 209,000 jobs during the same timeframe, well above the LSEG economists’ estimates of 127,000. Job gains occurred in health care, social assistance, transportation and warehousing, as well as retail, but declined in federal government in accordance with cutbacks.
The unemployment rate and number of unemployed persons edged up to 4.2% and 7.1 million, respectively. According to the U.S. Bureau of Labor Statistics, the labor force participation and long-term unemployed (those jobless for 27 weeks or more) rates were relatively unchanged at 62.5% and 21.3%, respectively.
In addition, average hourly earnings increased 0.3% month-over-month, in line with the forecast. However, the annual rate of 3.8% was 0.1 percentage point below the estimate and is the lowest level since July 2024. The average work week was unchanged at 34.2 hours.
“Today’s better-than-expected jobs report will help ease fears of an immediate softening in the U.S. labor market,” says Lindsay Rosner, head of multi-sector fixed income investing at Goldman Sachs Asset Management. “However, this number has become a side dish with the market just focusing on the entrée: tariffs.”
While previous indicators showed the labor market holding strong, assertive tariff moves raise the likelihood of companies pulling back on hiring as they assess exactly what the new trade landscape will look like.
Despite revisions to job gains in January and February – down 14,000 and 34,000, respectively – March numbers prove resilience in the U.S. market.
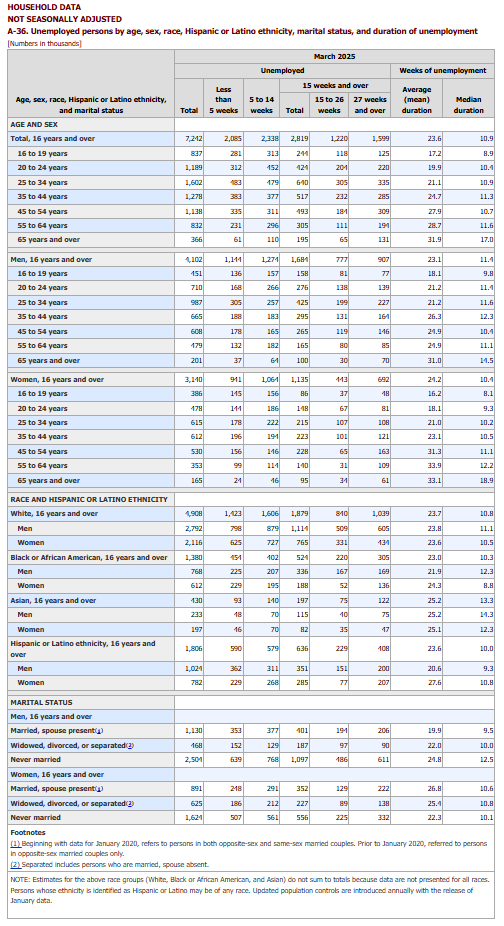
By Demographic
This month, unemployment rates among the major worker groups were: adult women – 3.7%; adult men – 3.8%; teenagers – 13.7%; Asians – 3.5%; Whites – 3.7%; Hispanics – 5.1%; and Blacks – 6.2%. Last month, unemployment rates among the major worker groups were: adult women – 3.8%; adult men – 3.8%; teenagers – 12.9%; Asians – 3.2%; Whites – 3.8%; Hispanics – 5.2%; and Blacks – 6%.
By Industry
The Conference Board Employment Trends Index (ETI) increased to 109.03 in March, compared to a downwardly revised 108.47 in February. For context, the current reading is in line with or above October, November and December 2024, as well as January 2025, at 108.25, 109.45, 109.23 and 108.35, respectively.
- Initial claims for unemployment insurance (an ETI component) declined in March, following an increase in February. This was driven by federal and private-sector layoff announcements.
- The share of involuntary part-time workers declined to 17.4%, after reaching 18% in February – its highest level since 2021.
- The share of consumers who report “jobs are hard to get” – an ETI component from the Consumer Confidence Survey® – fell to 15.7%, following a five-month high in February.
- The share of small firms that report jobs are “not able to be filled right now” rose for the second consecutive month to 40%, the highest share since August 2024.
- Employment in the temporary-help industry declined for the third consecutive month in March, with losses now totaling 25,000 over the first quarter.
- Job openings missed forecasts in February, falling by nearly 200,000 after rising in January.
- Strength in industrial production and real manufacturing and trade sales are likely due, in part, to a ramp-up of activity ahead of new tariffs taking effect. However, real sales for nondurables manufacturing, wholesale and retail each showed weaker data in January, in line with other first quarter spending indicators.
“While the U.S. labor market held steady in March, declining confidence among businesses and consumers suggests that the labor market may face increasing headwinds moving forward,” says Mitchell Barnes, economist at The Conference Board. “Over the course of 2025, government layoffs and the implementation of new tariffs could raise the unemployment rate from 4.2% in March to roughly 4.7%.”
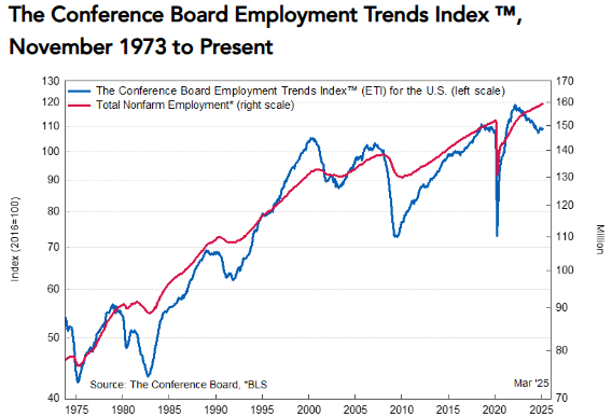
Caption: The Employment Trends Index is a leading composite index for payroll employment. When the Index increases, employment is likely to grow as well, and vice versa. Turning points in the Index indicate that a change in the trend of job gains or losses is about to occur in the coming months.
Important takeaways, courtesy of the U.S. Bureau of Labor Statistics:
- Health care added 54,000 jobs in March, in line with the average monthly gain of 52,000 during the past 12 months. Employment continued to trend up in ambulatory health care services (+20,000), hospitals (+17,000), as well as nursing and residential care facilities (+17,000).
- Employment in social assistance increased by 24,000, higher than the average monthly gain of 19,000 during the prior 12 months. Individual and family services added 22,000 jobs month-over-month.
- Retail trade added 24,000 jobs, as workers returning from a strike contributed to a job gain in food and beverage retailers (+21,000). General merchandise retailers lost 5,000 jobs. Employment in retail trade changed little over the year.
Click here to review more employment details.


