
KPI – April 2024: Recent Vehicle Recalls
KPI – April 2024: State of Manufacturing
KPI – April 2024: State of the Economy
KPI – April 2024: Consumer Trends
Global Light Vehicle Sales
In March, the Global Light Vehicle (LV) selling rate was unchanged at 85 million units per year. Approximately 8 million vehicles were sold last month – a 2% year-over-year gain, with year-to-date (YTD) sales up over 4%.
Sales results were mixed. While China was up 18% month-over-month, the Q1 2024 average selling rate was down nearly 5 million units per year compared to Q4 2023. In the U.S., the light vehicle market increased by 5.5% year-over-year, with sales reaching 1.44 million units. Transaction prices continued to slow, while manufacturer incentives inched up. On the contrary, Europe continues to face challenges with raw sales in the West down 1% year-over-year. The Eastern European market finished Q1 on a strong note, with total sales pushing 1 million units (+28% YoY). According to GlobalData, the result was supported by continued strong performance in Turkey and robust recovery in Ukraine and Russia.
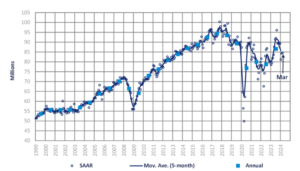
Caption: Market Lines is now excluding exports from the China sales total. The adjustment has been backdated to 2018.
“In 2024, we see total light-vehicle sales at 89.3 million units (adjusted for China exports), for a 3.2% increase and up about 200,000 units from our forecast a month ago,” says David Oakley, manager of Americas vehicle sales forecasts at GlobalData. “A large proportion of the easy gains have now been achieved due to improved inventory levels enabling pent-up demand to be met. In addition, inflation and the cost of living remain challenges facing consumers, while a slowdown in economic growth is still on the cards, even if recent data suggests that the global outlook is improving.”
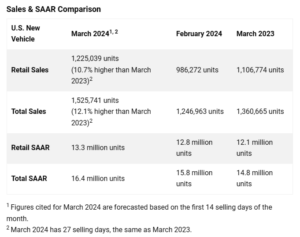
U.S. New Vehicle Sales
Total new-vehicle sales for March 2024, including retail and non-retail transactions, are projected to reach 1,525,700 units – a 12.1% year-over-year increase, according to a joint forecast from J.D. Power and GlobalData.
“Additionally, new-vehicle sales for the first quarter are projected to increase 4.5% from Q1 2023 when adjusted for selling days. In conjunction with robust sales for Q1, elevated transaction prices mean that consumers are expected to spend more than $129 billion buying new vehicles, an all-time Q1 record,” says Thomas King, president of the data and analytics division at J.D. Power.
“However, while the sales and expenditure performance are impressive, it is coming at the expense of reduced retailer and manufacturer profitability as inventories of unsold vehicles rise and competitive pressures intensify,” he continues.
Important Takeaways, Courtesy of J.D. Power:
- Retail buyers are on pace to spend $51 billion on new vehicles – up $3.1 billion year-over-year.
- Trucks/SUVs are estimated to account for 79% of new vehicle retail sales in March.
- The average new vehicle retail transaction price is expected to reach $44,186 – down $1,648 year-over-year.
- Average incentive spending per unit is expected to reach $2,800 – up from $1,680 in March 2023.
- Average interest rates for new-vehicle loans are predicted to jump to 6.8%, 13 basis points higher than a year ago.
- Total retailer profit per unit, which includes vehicles gross plus finance and insurance income, is expected to be $2,487 – down 31.9% year-over-year.
- Fleet sales are on pace to total 300,702 units in March, up 18.4% year-over-year on a selling day adjusted basis. To date, fleet volume is expected to account for 19.7% of total light-vehicle sales – up one percentage point from a year ago.
“With Q1 2024 almost complete, the industry is continuing along its trajectory back to pre-pandemic market dynamics. The bias is shifting from low sales volumes/high prices (and profits) to higher sales volumes/lower prices. That said, transaction prices and retailer profits remain well above pre-pandemic levels, while manufacturer discounts are well below. This means that, although 2024 will not deliver the record profits observed in recent years, it will likely be the fourth most profitable year on record for retailers,” King says.
Looking ahead, he expects rising inventories and rapidly intensifying competition for buyers to affect aggregate industry transaction prices and per unit profitability throughout the year.
Review a comprehensive 2024 forecast, courtesy of Cox Automotive.
U.S. Used Market
Wholesale used-vehicle prices (on a mix-, mileage- and seasonally-adjusted basis) decreased by 1.9% during the first 15 days of April. The mid-month Manheim Used Vehicle Value Index declined to 199.2 – 13.7% lower than the full month of April 2023.
“Historically, used retail sales peak in March or April of a given year as tax refunds inject money into the economy,” says Jeremy Robb, senior director of Economic and Industry Insights at Cox Automotive. “As the average tax refund is up 6% so far in 2024, consumers were driven to the used retail market earlier in the year, leading to stronger used-vehicles sales in February than we have seen the last couple of years.”


