
KPI – April 2024: State of Manufacturing
KPI – April 2024: State of Buisness – Automotive Industry
KPI – April 2024: State of the Economy
KPI – April 2024: Recent Vehicle Recalls
Below is a synopsis of consumer confidence, sentiment, demand and income/spending trends.
The Conference Board Consumer Confidence Index® decreased slightly from 106.7 (1985=100) in February to 104.7 (1985=100) in March. The Present Situation Index – based on consumers’ assessment of current business and labor market conditions – increased to 151.0 (1985=100). Meanwhile, the Expectations Index – based on consumers’ short-term outlook for income, business and labor market conditions – dipped to 73.8 (1985=100). Historically, an Expectations Index reading below 80 often signals a forthcoming recession.
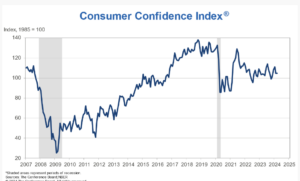
According to Dana Peterson, chief economist at The Conference Board, consumers’ assessment of the present situation improved slightly in March, while views of future conditions proved more pessimistic.
Data shows confidence increased among consumers aged 55 and over but declined for those under 55. Moreover, consumers in the $50,000-$99,999 income group reported lower confidence in March, while confidence improved slightly among all other income groups. Over the past six months, Peterson says confidence has been moving sideways, with no real trend to the upside or downside by income or age group.
“Consumers remained concerned with elevated price levels, which predominated write-in responses. March’s write-in responses showed an uptick in concerns about food and gas prices but, in general, complaints about gas prices have been trending downward,” she says.
In addition, expectations for the next six months dropped to the lowest level since October 2023. Consumers’ outlook for future business conditions, labor market conditions, income expectations and family financial situations all “deteriorated” in March.
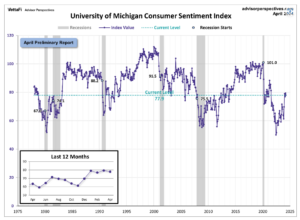
Similarly, the University of Michigan Survey of Consumers – a survey consisting of approximately 50 core questions covering consumers’ assessments of their personal financial situation, buying attitudes and overall economic conditions – finished at 79.4 in March, with a preliminary reading of 77.9 in April.
According to Survey of Consumers, sentiment moved sideways for the fourth straight month, as consumers perceived few meaningful developments in the economy.
- Year-ahead inflation expectations inched up from 2.9% last month to 3.1% this month, finishing slightly above the 2.3-3.0% average in the two years prior to the pandemic.
- Long-run inflation expectations also edged up from 2.8% last month to 3% this month.
Consumer Income & Spending
According to the U.S. Bureau of Economic Analysis (BEA), in February 2024 personal income increased $66.5 billion (0.3% at a monthly rate), while disposable personal income – personal income less personal current taxes – increased $50.3 billion (0.2%).
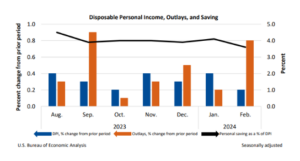
In addition, personal outlays – the sum of personal consumption expenditures, personal interest payments and personal current transfer payments – increased $149.9 billion (0.8%) and consumer spending increased $145.5 billion (0.8%). Personal saving was $745.7 billion and the personal saving rate – personal saving as a percentage of disposable personal income – was 3.6% in February.
Important Takeaways, Courtesy of BEA:
- In February, the $145.5 billion climb in consumer spending reflected an increase in both services and goods. Within services, the largest contributors to the increase were financial services and insurance (led by financial service charges, fees and commissions); transportation services (led by air transportation); as well as housing and utilities (led by housing). The largest contributor to the jump in goods was motor vehicles and parts (led by new light trucks).
- Overall, the PCE price index rose 0.3% in February. Food prices edged up 0.1%, while energy prices increased 2.3%. Moreover, the PCE price index increased 2.5% year-over-year, with prices for services swelling 3.8% and prices for goods decreasing 0.2%. Food prices increased 1.3%, but energy prices decreased 2.3%. Excluding food and energy, the PCE price index rose 2.8% year-over-year.


