KPI — April 2023: State of Business
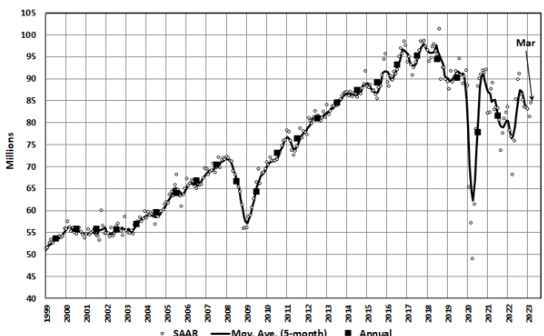
LMC Automotive reports Global Light Vehicle (LV) sales volume rose to 84 million units per year in March. More countries point to“easing supply shortages,” as evidenced by the increased raw monthly registration figure of 8.2 million units, or approximately 12% year-over-year growth.
The month-over-month increase in SAAR performance is largely attributed to the rebounding of the Chinese market, with customers taking advantage of tax incentives before April. Both the North American and Western Europe markets also posted year-over-year improvements, albeit against weak 2022 metrics. In March, Eastern Europe registered its first positive year-over-year growth since the start of the war in Ukraine.
“The automotive environment in 2023 remains challenging and while there are some warning signs in the banking industry and with the general economy, the outlook for global vehicle sales has been increased by 200,000 from a month ago to 86.1 million units, up 6.2% from 2022. Supply disruption is expected to continue to ease, shifting the level of recovery over to the consumer to decide,” says Jeff Schuster, president of global forecasts at LMC Automotive.
State of Manufacturing
Economic activity in the manufacturing sector contracted in March for the fifth consecutive month following a 30-month period of growth, according to the nation’s top supply executives. The March Manufacturing PMI® registered 46.3%, 1.4 percentage points lower than the 47.7% recorded a month ago. The Manufacturing PMI® is at its lowest level since May 2020, when it registered 43.5%.
“The U.S. manufacturing sector contracted again, with the Manufacturing PMI® declining compared to the previous month. With Business Survey Committee panelists reporting softening new order rates over the previous 10 months, the March composite index reading reflects companies continuing to slow outputs to better match demand for the first half of 2023 and prepare for growth in the late summer/early fall period,” says Timothy R. Fiore, CPSM, C.P.M., chair of the Institute for Supply Management® (ISM®) Manufacturing Business Survey Committee.
Important takeaways, Courtesy of the Manufacturing ISM® Report On Business®:
- Demand eased, with the (1) New Orders Index contracting at a faster rate, (2) New Export Orders Index still below 50% and declining, (3) Customers’ Inventories Index entering the high end of a ‘just right’ level, a negative for future production and (4) Backlog of Orders Index sagging again and continuing in contraction.
- Output/Consumption (measured by the Production and Employment indexes) was negative, with a combined 1.7-percentage point downward impact on the Manufacturing PMI® calculation.
- The Employment Index remained in contraction after two months of marginal expansion.
- The Production Index logged a fourth month in contraction territory, though at a slightly lower rate. Panelists’ comments now indicate equal levels of activity toward expanding and contracting head counts at their companies, amid mixed sentiment regarding the return of growth early in the second half of the year.
- Inputs – defined as supplier deliveries, inventories, prices and imports – continue to accommodate future demand growth.
- The Supplier Deliveries Index indicated faster deliveries, and the Inventories Index dipped into contraction as panelists’ companies continue to manage their total supply chain inventories and liquidity.
- The Prices Index dropped back into ‘decreasing’ territory after one month of increasing prices preceded by four straight months below 50%.
U.S. New Vehicle Sales
Total new vehicle sales for March 2023, including retail and non-retail transactions, are projected to reach 1,330,700 units – a 6.2% increase from March 2022, according to a joint forecast from J.D. Power and LMC Automotive.
“Retail demand for vehicles remains strong, due primarily to considerable pent-up demand. The availability of new vehicles in inventory at retailers is improving, resulting in a softening of dealer margins and increased manufacturer incentive spending. But, overall, the industry remains supply constrained and profitability is well above historical norms,” says Thomas King, president of the data and analytics division at J.D. Power.
“This dynamic of high transaction prices despite increased production levels is being assisted by an increased manufacturer focus on sales to fleet customers. Rather than allocate incremental production to retailers, manufacturers are selling more vehicles to fleet buyers. Sales to fleet buyers are expected to increase 31% from a year ago,” King adds.
Important Takeaways, Courtesy of J.D. Power:
- Retail buyers will spend $50 billion on new vehicles, up $2.6 billion year-over-year.
- Truck/SUVs are on pace to account for 77.5% of new vehicle retail sales in March.
- The average new vehicle retail transaction price in March is expected to reach $45,818, a 3.5% year-over-year increase.
- Average interest rates for new vehicle loans are estimated to increase to 6.66%, 228 basis points higher than a year ago.
- Total retailer profit per unit – inclusive of grosses and finance and insurance income – is approximately $3,761, down 23.4% year-over-year but still more than double 2019.
- Fleet sales are expected to total 240,200 units in March, up 31.4% year-over-year on a selling day adjusted basis. Fleet volume is expected to account for 19% of total light-vehicle sales, up from 15% a year ago.
“Overall, the first quarter of 2023 has been another period of remarkable profitability for both manufacturers and retailers. While the profit results for retailers are less favorable than a year ago, it will still be the second-best quarter on record,” King says.
“However, as vehicle production continues to increase during the year, interest rates will remain high, pent-up demand will diminish, pricing will become more competitive and profitability will inevitably degrade,” he continues. “Regardless, the industry is still positioned to enjoy one of the most profitable years on record.”
U.S. Used Market
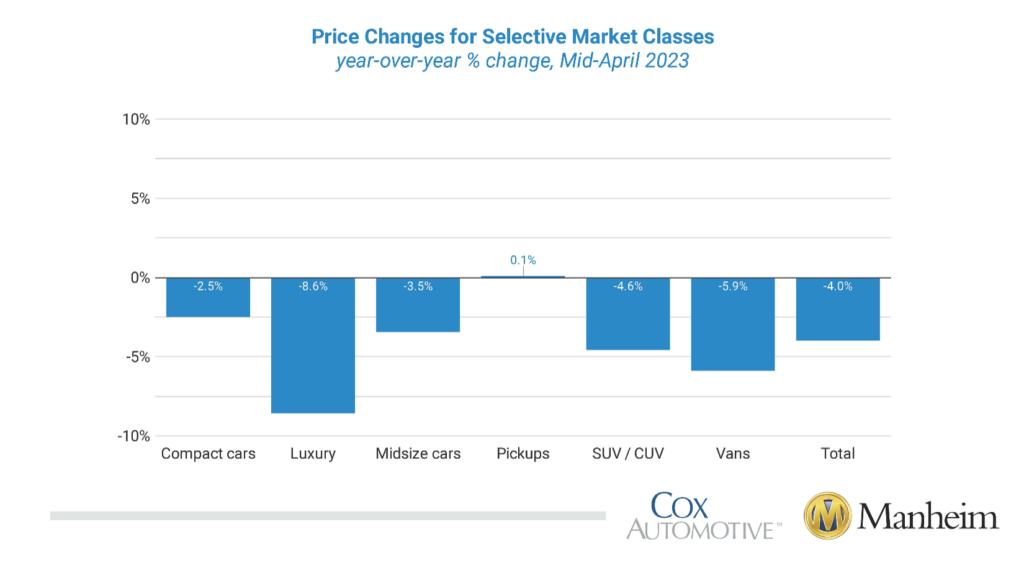
Wholesale used-vehicle prices (on a mix-, mileage- and seasonally-adjusted basis) decreased 2.7% during the first 15 days of April. In turn, the mid-month Manheim Used Vehicle Value Index dropped to 231.7 – down 4% from the full month of April 2022.
According to Manheim, seven of eight major market segments posted seasonally-adjusted prices that were lower year-over-year during the first half of April. Pickups ticked up a minimal 0.1%, while midsize and compact cars lost less compared to the overall industry in seasonally adjusted year-over-year changes. The remaining segments declined between 4.6% and 8.6%, with luxury units “faring the worst.” Seven of eight major segments saw price decreases compared to March, with losses ranging from 1.2% to 2.9%. Manheim says sports cars were the lone exception, with a 1.4% increase since March.
Used-vehicle price declines are resulting in less trade-in equity for new-vehicle buyers. Currently, JD Power says the average trade-in equity is approximately $8,800, which is down $430 from a year ago and $1,240 since the peak in June 2022. For context, however, trade equity is more than double the pre-pandemic level, thus helping owners with a vehicle to trade in offset some of the pricing and interest rate hikes.
KPI — April 2023: Recent Vehicle Recalls
Key Performance Indicators Report — April 2023


