KPI — April 2021: Consumer Trends

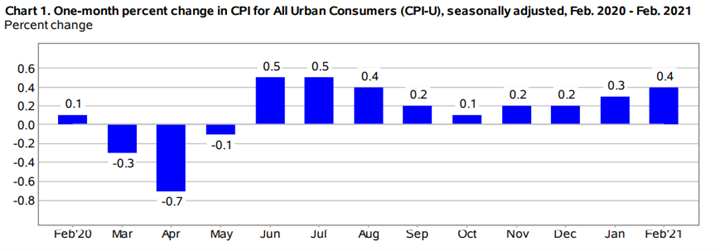
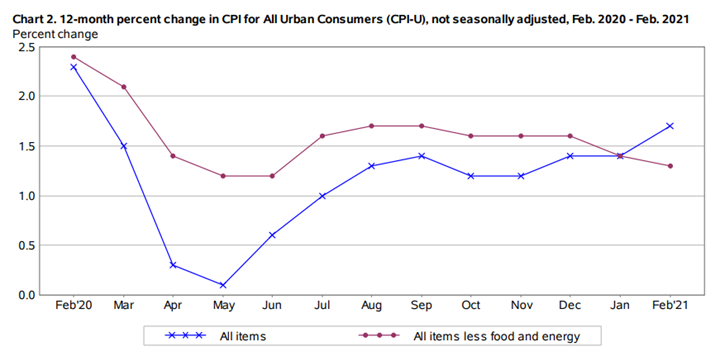
The Consumer Price Index for All Urban Consumers (CPI-U) increased .4% in February on a seasonally adjusted basis a .3% rise in January, according to the U.S. Bureau of Labor Statistics. Over the last 12 months, the all items index increased 1.7% before seasonal adjustment.
Important Takeaways, Courtesy of the U.S. Bureau of Labor Statistics:
- The gasoline index increased 6.4%, accounting for more than half of the seasonally adjusted increase in the all items index.
- The electricity and natural gas indexes also increased, with the energy index rising 3.9% month-over-month.
- The food index increased .2%.
- The index for all items less food and energy rose .1%.
- The indexes for shelter, recreation, medical care and motor vehicle insurance all increased month-over-month.
- The indexes for airline fares, used cars and trucks, as well as apparel all declined.
- The index for all items less food and energy rose 1.3% over the last 12 months, a smaller increase than the 1.4% rise for the 12 months ending January. The food index rose 3.6% over the last 12 months, while the energy index increased 2.4% during that period.
Consumer Sentiment & Confidence
The Consumer Sentiment Index—a survey consisting of approximately 50 core questions that cover consumers’ assessments of their personal financial situation, buying attitudes and overall economic conditions—finished at 84.9 in March, according to University of Michigan Survey of Consumers.

Interestingly, both sides of the political spectrum are referencing current consumer data for supporting arguments. Recovery is far from complete, as only 45% of the fall in the Sentiment Index has been recovered, but the current and prospective stimulus and infrastructure spending has the potential to spark an inflationary psychology.
“The reestablishment of an inflationary psychology, however, will not occur immediately. Buy-in-advance psychology preceded actual inflation by about two years prior to 1980, with the lead time more variable but without any significant resurgence in the low inflation era. The key issues are not to underestimate the ultimate impact of economic policies on employment and inflation, and not to overestimate the ability of economic policies to bring any excesses to a painless soft-landing,” explained Richard Curtin, chief economist for the University of Michigan Survey of Consumers.
Within the Index, “Perhaps the most attention has been garnered by rising inflationary expectations,” said Curtin. “The year ahead inflation rate was expected to be 3.3% in February, up from 3% last month and 2.5% in December,” he noted.

This statistic shows the U.S. Consumer Sentiment Index from March 2020 to March 2021. The index is normalized to have a value of 100 in December 1964 and based on a monthly survey of consumers, conducted in the continental U.S. It consists of about 50 core questions which cover consumers’ assessments of their personal financial situation, their buying attitudes and overall economic conditions. The Consumer Sentiment Index stood at 84.9 in March 2021.
With sentiment on the upswing, the Conference Board Consumer Confidence Index® surged in March to its highest reading in a year. The Index now stands at 109.7 (1985=100), up from 90.4 in February.
“Consumers’ assessment of current conditions and their short-term outlook improved significantly, an indication that economic growth is likely to strengthen further in the coming months,” said Lynn Franco, senior director of economic indicators at The Conference Board. “Consumers’ renewed optimism boosted their purchasing intentions for homes, autos and several big-ticket items. However, concerns of inflation in the short-term rose, most likely due to rising prices at the pump, and may temper spending intentions in the months ahead.”
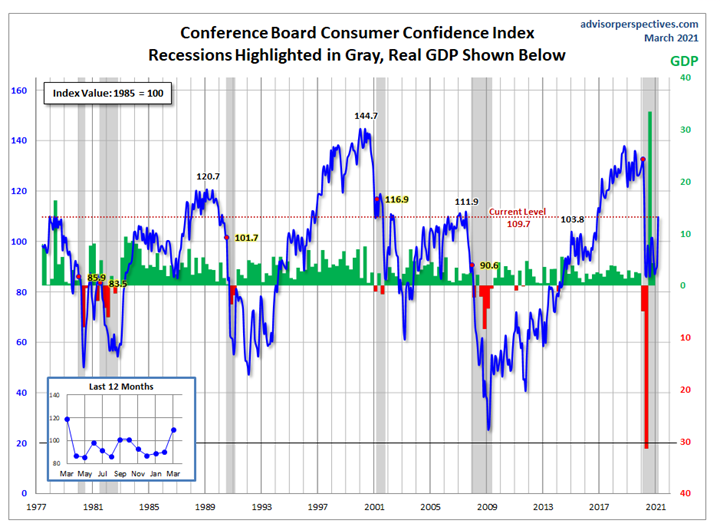
Jill Mislinski of Advisor Perspectives— a leading interactive publisher for Registered Investment Advisors (RIAs), wealth managers and financial advisors—put the recent consumer sentiment report into larger historical context as a coincident indicator of the economy. “Toward this end, we have highlighted recessions and included GDP. The regression through the index data shows the long-term trend and highlights the extreme volatility of this indicator. Statisticians may assign little significance to a regression through this sort of data. But the slope resembles the regression trend for real GDP shown below, and it is a more revealing gauge of relative confidence than the 1985 level of 100 that the Conference Board cites as a point of reference,” she noted.
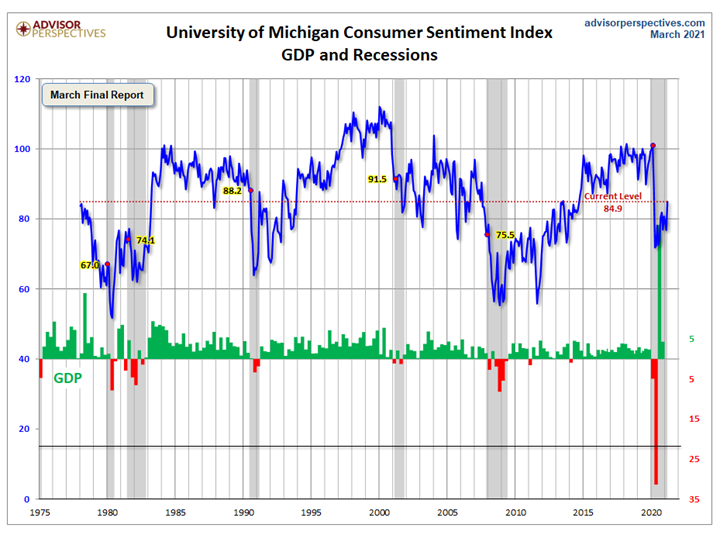
This is a long-term perspective on this widely-watched indicator. Recessions and real GDP are included to help evaluate the correlation between the Michigan Consumer Sentiment Index and the broader economy, explained Advisor Perspectives.
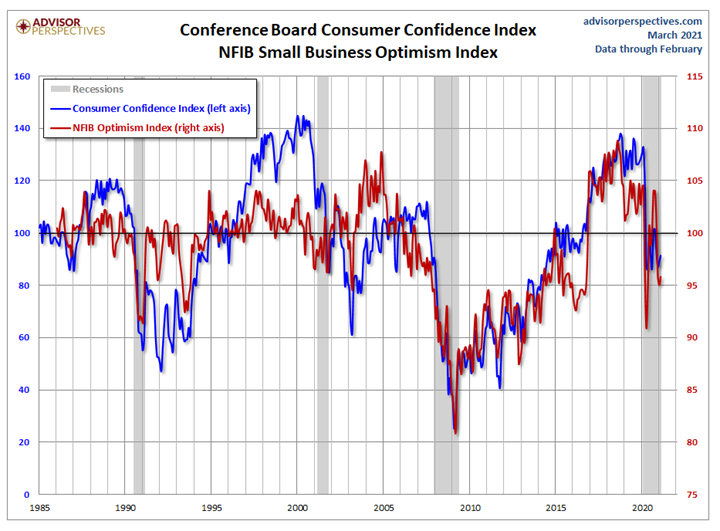
The prevailing mood of the Michigan survey is presented alongside the mood of small business owners, as captured by the NFIB Business Optimism Index (monthly update here).
Consumer Spending
While finalized monthly reporting was unavailable from the National Retail Federation (NRF) at the time of publishing, the economy certainly has come a long way since the near stand-still a year ago.
“Both monetary policy set by the Federal Reserve and fiscal policy set by Congress and the White House have responded with swift and overwhelming force to support the economy. NRF is optimistic that the recovery is accelerating and the needed rebuilding of the economy is underway. The rate of vaccinations is ramping up, and the numbers paint an increasingly encouraging picture,” said Jack Kleinhenz, chief economist at NRF.
Data clearly points to substantial year-over-year increases in consumer spending, albeit down slightly month-over-month.
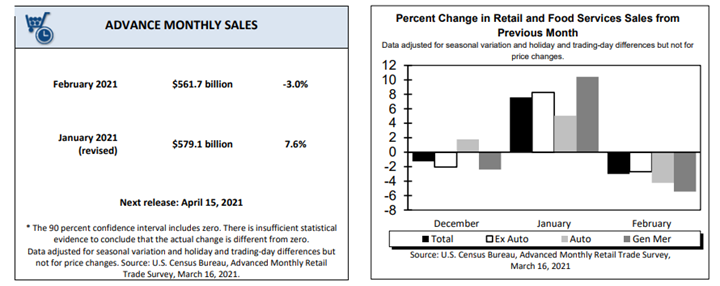
Advance estimates of U.S. retail and food services sales for February 2021—adjusted for seasonal variation and holiday and trading-day differences but not for price changes—were $561.7 billion, a month-over-month decrease of 3% (±0.5%) but 6.3% (±0.7%) above February 2020. Total sales for the December 2020 through February 2021 period were up 6% (±0.5%) year-over-year. The December 2020 to January 2021 percent change was revised from up 5.3% (±0.5%) to up 7.6% (±0.3%).
“The ultimate strength and duration of the spending surge will depend on the rate of draw-downs in savings since consumers anticipate a slower pace of income growth. Despite the vast decline in precautionary motives sparked by the easing of pandemic fears, those precautionary motives will not completely disappear,” said Richard Curtin, chief economist for the University of Michigan Survey of Consumers.
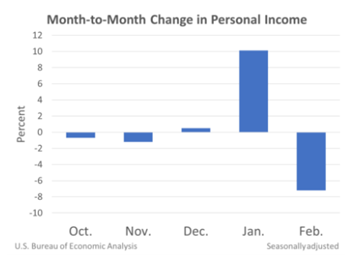
Personal income decreased $1,516.6 billion, or 7.1% at a monthly rate, while consumer spending decreased $149.0 billion, or 1%, in February. Click here to review the full report.
Key Performance Indicators Report — April 2021


