Key Performance Indicators Report – September 2019

State of the Economy
In recent SEMA e-News coverage, Kyle Cheng reported the current U.S. cycle of economic growth is at an historic 11th year amid volatility. At the beginning of August, President Trump announced that he would be moving forward with List 4 – 301 tariffs on approximately $300 billion in Chinese goods. The 10% tariff took effect Sept. 1 and covers nearly all remaining goods imported from China-3,805 full and partial tariff subheadings.
“The next round of proposed tariffs targets the remaining $300 billion in Chinese imports that haven’t been affected yet. This is widely believed to impact products more commonly purchased by consumers. As such, uncertainty is weighing on businesses, capital and the overall economy,” said Cheng.
Such trade tensions are influencing many industries including, but not limited to, automotive, specialty-equipment and RV. According to the RV Industry Association, this round of tariffs is expected to hit American consumers harder than previous ones since it includes goods like clothes, toys, electronics and other retail items. At the time of Cheng’s report, auto-parts imports from China were down roughly 11% year-to-date. However, total auto part imports are up-driven by increases from Mexico and other Asian trading partners.
Consumer confidence is optimistic despite current trade climate, with Cheng citing, “The labor market remains tight, wages are increasing and inflation remains low. Likewise, spending is at a healthy level. This should carry through the remainder of the year,” but there continues to be warnings of a recession ahead.
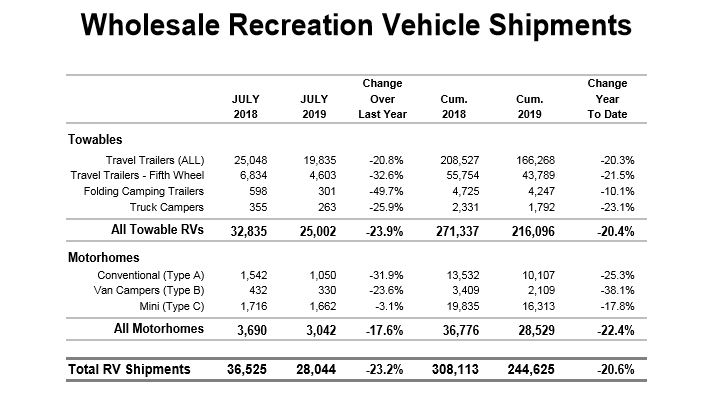
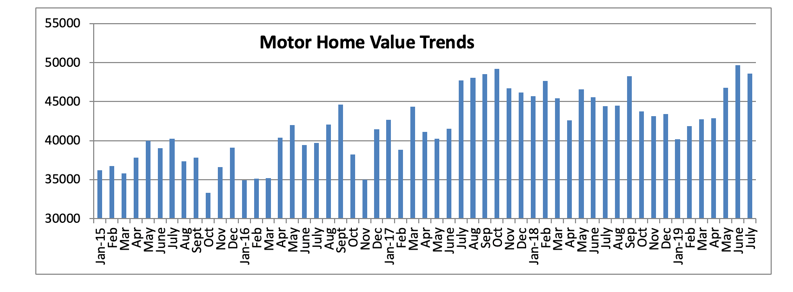
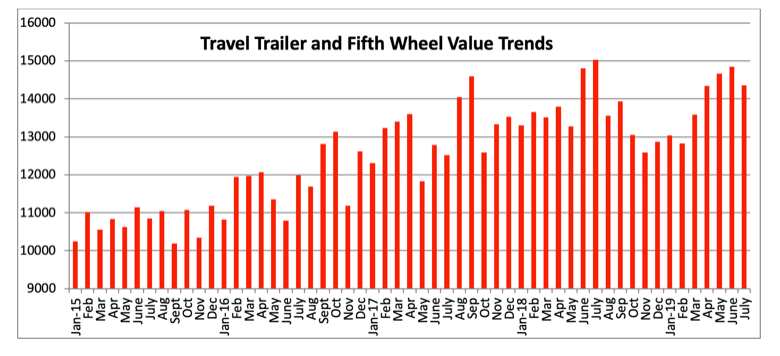
For example, RV shipments to dealers are down approximately 20% this year, which comes after a 4.1% drop last year, according to data from the RV Industry Association. Fact: multiyear drops in shipments have preceded the last three recessions.
“The RV industry is better at calling recessions than economists are,” said Michael Hicks, an economist at Ball State University, in Muncie, Ind. Softening consumer demand for RVs coupled with rising vehicle prices due to tariffs suggest the economy is either in a recession or soon headed for one, according to Hicks.
In recent coverage, RV PRO reported that Grand Design RV President and CEO Don Clark is not fearful of a recession. “I do think our industry is prepared for an adjustment. An adjustment does not have to be a recessionary period of time; it’s just a rightsizing of the retail market,” explained Clark.
Already, “Manufacturers have readjusted their production rates, they’re building more responsibly, they’re better matching the demands for the product, and even though we’ve gone through a slight dip in retail and a little bit heavier dip in wholesale because dealers are aligning their inventory, right sizing their inventory for the demand of the product today. Dealer inventories are now in line,” he added.
The automotive and RV industries, at least, appear prepared for whatever uncertainty is to come.
Metropolitan Area Employment and Unemployment Summary
According to the Bureau of Labor Statistics, more than 5.8 million new jobs have been created since January 2017. Furthermore, with a rate of 3.7% during August, unemployment has been at or below 4% for 18 straight months.
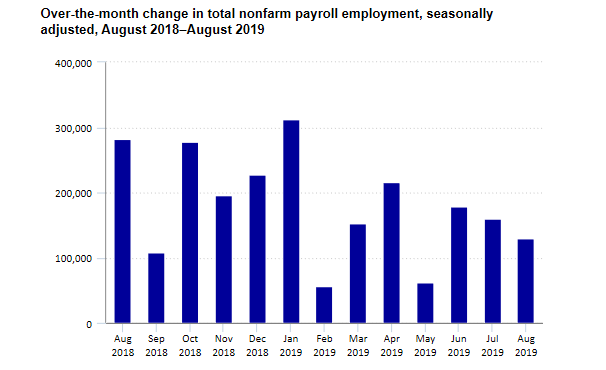
Image courtesy of the U.S. Bureau of Labor Statistics
As of July 2019, unemployment rates were lower than previous year in 217 of the 389 metropolitan areas, higher in 141 areas and unchanged in 31 areas, according to the U.S. Bureau of Labor Statistics. Furthermore, a total of 197 metropolitan areas had jobless rates below the U.S. rate of 4%, 172 areas had rates above it and 20 areas had rates equal to that of the nation.
During this timeframe, Burlington-South Burlington, Vermont reported the lowest unemployment rate in the nation at 1.8%, while Yuma, Arizona (22.1%) and El Centro, California (20.7%) had the highest unemployment rates during July. Additionally, Anniston-Oxford-Jacksonville, Alabama and Vineland-Bridgeton, New Jersey showed the largest year-over-year unemployment rate decreases during the same period, at −1.6 percentage points each. The U.S. Bureau of Labor Statistics said 18 other geographic areas experienced rate declines of at least 1.0 percentage point, with the largest year-over-year rate increase being in Sierra Vista-Douglas, Arizona at +1.2 percentage points.
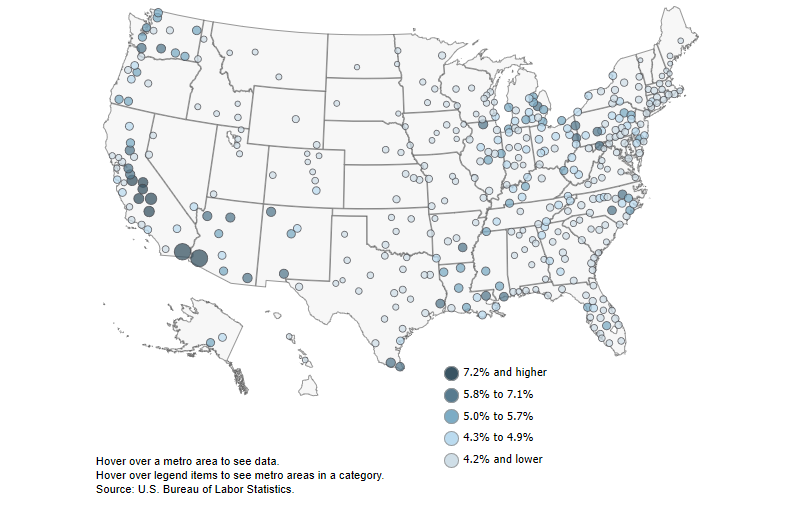
Image courtesy of the U.S. Bureau of Labor Statistics
Furthermore, total nonfarm payroll employment rose by 130,000 during August, according to the U.S. Bureau of Labor Statistics. There was little to no change among the major worker groups during August: rates for adult men-3.4%, adult women-3.3%, teenagers-12.6%, Whites-3.4%, Blacks-5.5%, Asians-2.8% and Hispanics-4.2%. Below are some highlights from recent reporting:
- In August, employment in federal government increased by 28,000. The gain was mostly due to the hiring of 25,000 temporary workers to prepare for the 2020 Census.
- Health care added 24,000 jobs over the month and 392,000 over the past 12 months. In August, employment continued to trend up in ambulatory health care services (+12,000) and in hospitals (+9,000). Also, financial activities employment rose by 15,000, with nearly half of the gain occurring in insurance carriers and related activities (+7,000). Financial activities added 111,000 jobs over the year.
- Employment in professional and business services continued to trend up in August (+37,000). Within the industry, employment increased by 10,000 both in computer systems design and related services and in management of companies and enterprises. Monthly job gains in professional and business services have averaged 34,000 thus far in 2019, below the average monthly gain of 47,000 in 2018.
- Social assistance employment continued on an upward trend in August (+13,000). Within the industry, individual and family services added 17,000 jobs. Social assistance has added 100,000 jobs in the last six months.
- Mining employment declined by 6,000 in August, with nearly all of the loss in support activities for mining (-5,000). Retail trade employment changed little in August (-11,000). General merchandise stores lost 15,000 jobs over the month and 80,000 jobs over the year. Building material and garden supply stores added 9,000 jobs over the month.
- Employment showed little change over the month in construction, manufacturing, transportation & warehousing, and leisure & hospitality. Job growth in these industries has moderated thus far in 2019 compared with 2018.
Average Hourly Earnings & Wages
Average hourly earnings for all employees on private nonfarm payrolls rose by 11 cents to $28.11 during August, following 9-cent gains in both June and July. Over the past 12 months, average hourly earnings have increased by 3.2 percent. During this same period, average hourly earnings of private-sector production and nonsupervisory employees increased by 11 cents to $23.59. Average hourly earnings increased by 3.2% year-over-year in August, according to the U.S. Bureau of Labor Statistics. This is the 13th straight month that wages have increased at or above 3%. Average hourly earnings for production and nonsupervisory workers also had the largest monthly increase since the series began in 1964.
Housing Statistics
While the economy has many moving parts, housing statistics have been a longtime indicator of economic health. Recently, the Federal Reserve Economic Data (FRED) released some telling data as it applies to the discussion.
“Reporters and analysts have been focused for some time on the possibility of an inverted yield curve, which has been seen as a powerful predictor of recessions. In short, an inverted yield curve implies investors believe current growth is stronger than future growth, which may slow spending and investment and may lead to a recession.”
For example, as FRED points out, housing expectations have declined prior to yield curve inversions since 1973. “If housing downturns predict yield curve inversions and yield curve inversions predict recessions, is it really housing downturns that predict recessions? It doesn’t get any less complicated when you consider that, by some measures, such as current house prices and time on market, several areas of the country have robust housing markets. Some might even call them hot.”
If this topic piques interest, review these essays from the Economic Synopses series and this FRED Blog post-both of which inject more hard data into the discussion.
New Vehicle Sales
August total new vehicle sales were up 11% year-over-year, according to Manheim, with the August SAAR reading 17.0 million-a moderate increase versus last year’s 16.9 million and up slightly from July’s 16.8 million rate. In fact, several of the reporting automakers posted numbers above the Cox Automotive forecast, with numerous models achieving “best-ever August” sales due to Labor Day weekend and unprecedented incentive program volume.
With the highest average incentive in 20 months, retail sales of new vehicles were up 9% in August, leading to a retail SAAR of 14.8 million, down from 14.9 million last August but the strongest retail SAAR since December.
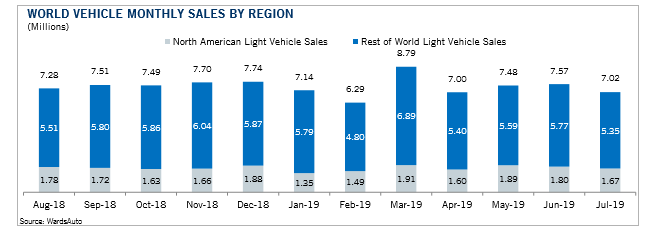
Image courtesy of Jefferies Automotive Aftermarket Report
“The incredible year-over-year performance for August sales we are seeing from the OEMs is in part due to the calendar. Major U.S. holiday weekends play a central role in driving new-vehicle sales. On average, the week including Labor Day weekend accounts for over 2% of yearly new retail sales making it one of the busiest weeks of the year along with Memorial Day weekend and the 4th of July. It is important to note that these numbers could have been even higher. Storm preparation and evacuations caused by Hurricane Dorian probably led to softer sales during this time, particularly in Florida, which is the third most important market for new-vehicle sales. Dorian likely subdued some year-over-year sales gains in the affected areas, putting downward pressure on national sales,” said Zo Rahim, manager of economics and industry insights at Cox Automotive.
Furthermore, new vehicle inventories came in under 4 million units for the fourth consecutive month and are at the lowest level since August 2016. “We saw unprecedented incentive program volume in August which keeps us on pace for a record-setting year. Automakers continue to use a plethora of targeted incentives to move inventory which contributes to the high incentive volume but is a smart way to strategically manage inventory mix and competitively adjust pricing and payments,” commented Brad Korner, general manager at Cox Automotive Rates & Incentives.
Staying on trend, transaction prices for new cars continued to rise year over year in August. According to Kelley Blue Book, the average transaction price for a new vehicle in the U.S. was $37,401, which is down slightly from last month but up 2% from year-ago levels.
Charlie Chesbrough, senior economist at Cox Automotive, warns there are some worrisome signals in the reported results. For example, small car sales posted big numbers for some OEMs, bucking recent trends, while their luxury brand numbers were weak. Chesbrough said this may suggest affordability is having an increasing impact on consumer purchases which, indirectly, could tie back to consumer fears of a looming recession.
Manheim Used Vehicle Index
According to Cox Automotive, total used vehicle sales volume was up 1.8% year-over-year in August. Manheim put the August used SAAR at 39.8 million, an increase from 39 million last August and up slightly from July’s 39.7 million rate. As such, the Manheim Used Vehicle Value Index increased to 141.3 during August-a 1.2% boost from a year ago and a record high for the Index-while wholesale used vehicle prices (on a mix-, mileage- and seasonally adjusted basis) experienced a month-over-month increase of 0.62%.
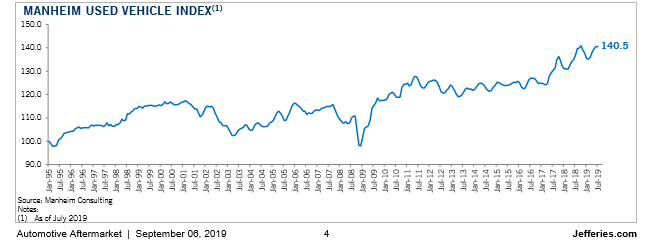
Image courtesy of Jefferies Automotive Aftermarket Report
July brought stability in weekly Manheim Market Report (MMR) prices, but depreciation returned in August, albeit at a very low level. According to Manheim, three-year-old vehicle values in aggregate were down 0.5% for the month, when prices normally decline by at least 1%. “As a result of low depreciation, prices in aggregate in non-luxury remain higher than the beginning of the year. Last August saw price appreciation, which is why the year-over-year comparison in values is the weakest in more than two years,” explained Manheim.
Key points from the latest Manheim Used Vehicle Index report are included below:
- On a year-over-year basis, major market segments saw weak seasonally adjusted price gains in August. Luxury cars and pickups outperformed the overall market, while most other major segments underperformed the overall market.
- Last year continues to be a tough comparison for both prices and sales, as the market experienced an abnormal increase in consumer demand during the summer driven by tariff fears and rising interest rates. Despite the tough comparison, August reflected a much stronger than normal used retail market for a summer month.
- According to Cox Automotive estimates, total used vehicle sales volume was up 1.8% year-over-year in August. Manheim estimates the August used SAAR to be 39.8 million, up from 39 million last August and up slightly from July’s 39.7 million rate. The August used retail SAAR estimate is 20 million, up from 19.3 million last August and flat month-over-month.
- Second-quarter economic growth as measured by GDP was revised down slightly to 2.0% from the originally reported 2.1%. Consumer spending was revised up and played a much larger role than originally anticipated, as exports, inventories and residential investment were revised down. Consumer Confidence, as measured by the Conference Board, declined modestly in August by 0.4% to 135.1 from the highest reading so far this year in July. The percentage of households reporting plans to purchase a vehicle in the next six months improved to its best level in three months in August. Purchase intentions remain similar to last year. Plans to buy a house surprisingly fell in August to the lowest level in four months but remain similar to last year.
NTEA releases 20th edition of Annual Manufacturers’ Shipments Survey Report
Recently, the National Truck Equipment Association (NTEA) released its 20th edition Annual Manufacturers’ Shipments Survey (AMSS) Report, which revealed that truck equipment industry shipments increased 15.9% in 2018-a significant boost from the 2.9% climb the previous year.
According to Manheim, strong fleet sales continue to support the new vehicle market. Combined rental, commercial, and government purchases of new vehicles were up 23% year-over-year in August. Commercial (+10%) and rental (+45%) fleet channels were up year-over-year in August. Fleet sales are up 7.3% in 2019 through August, and retail sales are down 1.3%, as the overall new vehicle market is up 0.1% this year.
Featuring 2018 data, the report assists industry professionals in estimating market size by dollars and units for 77 product lines. NTEA collects and evaluates aggregate results based on data submitted from 93 participating companies. The commercial vehicle community can lean on directional guidance from this report to help assess business performance.
“Beyond insights into annual growth, AMSS offers reliable market size data in terms of dollars and units,” said Steve Latin-Kasper, NTEA director of market data and research. “It’s a powerful tool that aligns with our mission of furthering industry knowledge, growth and profitability by helping companies in the work truck sector effectively evaluate market potential and develop sound strategic plans.” This resource can help shop owners like you:
- Better approximate market size
- Learn how much the market grew (in terms of units/dollars)
- Determine whether or not your company kept pace
- Compare your business to the industry as a whole
Automotive Aftermarket KPI
Did you know that Americans spend an additional 20 minutes driving each week compared to 2014, according to new research from the AAA Foundation for Traffic Safety? “Over the course of the year, Americans collectively spent 70 billion hours behind the wheel- an eight percent increase since 2014. The AAA Foundation’s American Driving Survey shows that on average, U.S. drivers spend nearly an hour behind the wheel each day and travel 31.5 miles- a five percent increase from 2014,” said Tamra Johnson, manager at AAA Public Relations.
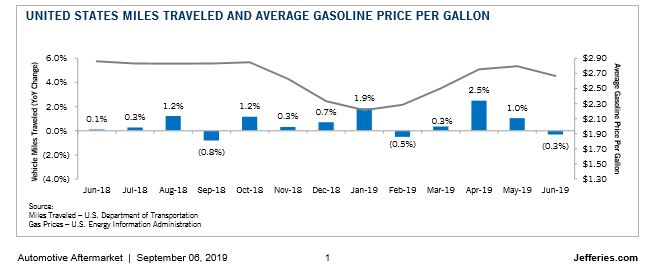
Image courtesy of Jefferies Automotive Aftermarket Report
If drive time is on the rise, seat quality and comfort become even more important. According to the J.D. Power 2019 U.S. Seat Quality and Satisfaction Survey, manufacturers hear consumer demands and are responding accordingly. The survey measures quality by the number of problems experienced per 100 vehicles (PP100) during the first 90 days of ownership-a lower score reflects higher quality. According to the latest results, which show a 6.3 seat-related PP100, seat quality is now at the highest level since the study was redesigned in 2013, representing an improvement of 3.2 PP100 over that period.
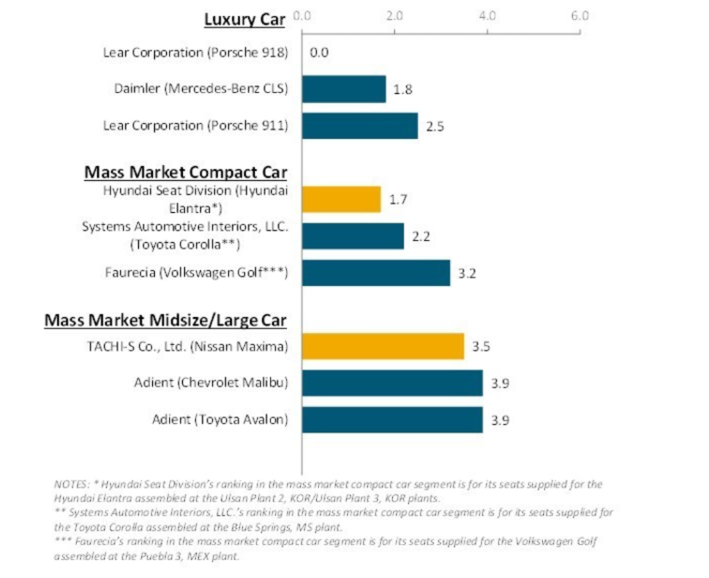
Image courtesy of Aftermarket News
“With every vehicle redesign comes the chance for seat upgrades and improvements based on consumer feedback. As quality and satisfaction levels continue to increase, it is clear the manufacturers are capitalizing on opportunities to upgrade and perfect their seats every chance they get,” said Brent Gruber, senior director of Global Automotive Quality Practice at J.D. Power.
On the other hand, American consumers are not listening as intently-delaying car maintenance to the tune of nearly $25 billion, according to the Auto Care Factbook 2020 and IMR Inc. Brake pads, tire changes and oil changes rank at the top of the list.
“We surveyed 100,000 households about how they’ve maintained their vehicles and whether they’ve knowingly delayed any maintenance on those vehicles,” said Bill Thompson, CEO, IMR, Inc. “We found that a surprising amount of households are knowingly delaying vehicle maintenance and that the primary reasons are economic, convenience and a perception that delaying the maintenance isn’t quite effecting vehicle performance.”
Setbacks in consumer vehicle maintenance can prove costly. With 278 million cars on America’s highways and byways, these delays equate to more than 5 million delayed brake jobs, nearly 7 million unchanged tires and 11 million cars in need of an oil change. “Ultimately, servicing your vehicle at the recommended service intervals can keep money in your pocket by avoiding more unintentional wear, a catastrophic failure or worse case, an accident,” said Thompson.
This is an opportune time of year for shop owners to promote routine vehicle maintenance and winter preparations.
- The showroom setup should reflect seasonal inventory.
- Liven up the storefront with updated merchandising displays, graphics and demo areas.
- Managers should be promoting consumer rebates and in-store offers to drive traffic.
Image courtesy of Jefferies Automotive Aftermarket Report
Industry Events
The Annual Specialty Equipment Market Association (SEMA) Show: SEMA is the must-attend event across the industry. From Nov. 5-8, 2019 in Las Vegas, industry professionals across the spectrum of wheel, tire, racing, performance, audio, paint, collision repair, vehicle care and tool products for street rods, hot rods, sport compacts, exotics, trucks, ATVs and UTVs join together for a trade show experience unlike any other.
This year, an all-new SEMA Overland Experience area is planned. With significant crossover into the off-road segment, overlanding products are common at the SEMA Show. The phenomenon has strong roots in several countries and regions around the world including Australia, South Africa and certain parts of South America. Not to mention, it has taken off in the United States during the past decade.
According to a recent SEMA e-News, the dedicated section will be in the Performance Pavilion and “feature dozens of customized vehicles outfitted for survival with fully popped-out tents, sunshades and portable kitchen systems displayed alongside exhibitors supporting the growing overlanding market.” Industry professionals benefit from a panel of experts who will be present to share and discuss trends, business opportunities and challenges in the overlanding market.
“The new Overland Experience showcases a growing trend in the market,” said Tom Gattuso, SEMA vice president of events. “With overlanding products, vehicles and education displayed in a centralized location, buyers will gain a comprehensive understanding of what the market entails and how they can build overlanding into their businesses.”
The 2019 AASA Technology Conference: The AASA Technology Conference, held at the Boca Raton Resort & Club in Boca Raton, Fla., is the industry’s top technology event and will foster an educational environment for all attendees. Through this year’s theme of Digitizing the Aftermarket, learn about and discuss business processes, IT, part data, vehicle data, online, connected and smart part technologies that are converging and creating new opportunities for the aftermarket.

Image courtesy of Automotive Aftermarket Suppliers Association
Planned highlights for the Conference:
- Topics – Blockchain Applications for the Aftermarket, Commercial Vehicle Technology Moves Forward Quickly, Developing Digital Aftermarket Products, Bridging OE and Aftermarket Technologies, AI and Machine Learning Case Study, Shop of the Future
- Technology Tracks – Heavy Duty, Marketing/B2B & E-commerce
- Technology Displays
- Networking: Banquet, Receptions, Door Prizes
- Live Technology Demonstrations
- Entricit – telematics and predictive analytics
- Predii – telematics and predictive analytics
- Mammoth – 3D printing, robotics
- Continental – connected aftermarket
- FenSens – ADAS
- TireStamp – next generation sensors
- Sensata – next generation sensors
- Huecore – ADAS
- asTech – ADAS calibration
- -‹National Automotive Service Task Force-‹
Auto Revolution: J.D. Power’s newest annual event is designed to fuel innovation and drive an auto revolution-a place where auto trends and innovative minds unite to advance the future. Held October 23-24 at ARIA Resort & Casino 3730 S Las Vegas Blvd, Las Vegas, NV 89158, Auto Revolution promises to be highly engaging, fast-paced and full of tools to help attendees advance and win during these dynamic times. Ninety percent of J.D. Power event attendees are manager level and above including C-Level, SVP, and Senior Directors. Here’s who you can expect:
- Auto Engineers
- Business Leaders
- OEM Product Managers
- Quality Managers
- Dealers
- Tech Innovators
- OEM Start-ups
- F&I Leaders
- Data Analysts
- Auto Marketers
- CX Professionals
- Media & Journalists
- Investor Communities
View the full agenda here and speakers here.

Image courtesy of J.D. Power
Consumer Confidence
While consumer confidence remains high overall, the Conference Board Consumer Confidence Index® reported a marginal decline during August-135.1 (1985=100), down from 135.8 in July. The Present Situation Index, which is based on consumers’ assessment of current business and labor market conditions, increased from 170.9 to 177.2. However, the Expectations Index-taking into account consumers’ short-term outlook for income, business and labor market conditions-experienced a decline from 112.4 last month to 107.0 this month.
“Consumer confidence was relatively unchanged in August, following July’s increase,” said Lynn Franco, senior director of economic indicators at The Conference Board. “Consumers’ assessment of current conditions improved further, and the Present Situation Index is now at its highest level in nearly 19 years (Nov. 2000, 179.7). Expectations cooled moderately, but overall remain strong. While other parts of the economy may show some weakening, consumers have remained confident and willing to spend. However, if the recent escalation in trade and tariff tensions persists, it could potentially dampen consumers’ optimism regarding the short-term economic outlook.” Notable highlights from this month’s report are included below:
- The percentage of consumers claiming business conditions are “good” increased from 39.9% to 42%, while those saying business conditions are “bad” decreased from 11.2% to 9.8%.
- Consumers’ appraisal of the job market was also more favorable. Those saying jobs are “plentiful” increased from 45.6% to 51.2%, while those claiming jobs are “hard to get” declined from 12.5% to 11.8%.
- Consumers were moderately less optimistic about the short-term outlook in August. The percentage of consumers expecting business conditions will be better six months from now decreased from 24% to 21.9%, while those expecting business conditions will worsen increased from 8.4% to 10%.
- Consumers’ outlook for the labor market was also slightly less positive. The proportion expecting more jobs in the months ahead decreased marginally from 19.9% to 19.7%, while those anticipating fewer jobs increased from 11.1% to 13.6%.
- Regarding their short-term income prospects, the percentage of consumers expecting an improvement decreased from 24.9% to 23.8%, however, the proportion expecting a decrease declined, from 6.6% to 5.8%.
Small Business Index
The NFIB Small Business Optimism Index indicates that August was a solid month for small businesses overall; however, the index fell 1.6 points to 103.1. Job creation accelerated, positive earnings trends improved and quarter-on-quarter sales gains remained strong, but NFIB said optimism decreased because fewer owners expect better business conditions and real sales volumes in the coming months.
“In spite of the success we continue to see on Main Street, the manic predictions of recession are having a psychological effect and creating uncertainty for small business owners throughout the country,” said NFIB President and CEO Juanita D. Duggan. “Small business owners continue to invest, grow, and hire at historically high levels, and we see no indication of a coming recession.”
The Uncertainty Index rose four points during the reported timeframe, suggesting that small business owners are reluctant to make major spending commitments. “In fact, the main impediment to more growth is the record level of no qualified workers,” according to NFIB. Below are some highlights from the most recent report.
- Capital spending posted strong improvements in August, with 59% of owners reporting capital outlays, up two points from the month before. Of those making expenditures, 42% reported spending on new equipment, 24% acquired vehicles and 18% improved or expanded facilities. Four percent acquired new buildings or land for expansion, while 15% spent money for new fixtures and furniture.
- Twenty-eight percent are planning capital outlays in the next few months. Plans to invest were the strongest in manufacturing (35%), agriculture (30%) and wholesale trades (30%).
- Owners raising average selling prices fell five points to a net 11% (seasonally adjusted), reversing July’s seven point surge. Price hikes were the most frequent in wholesale trades (14% lower, 30% higher), the sector most likely to feel the effects of tariffs.
- Owners planning price hikes fell five points to a seasonally adjusted net 17%. Eleven percent reported cutting selling prices in recent months, and only two percent plan to do so. That suggests most price cutting is an unplanned response to market conditions, which is a healthy process. The frequency of reports of positive profit trends improved three points (after three points in July) to a net negative one percent reporting quarter on quarter profit improvements, the third highest reading in the survey’s history.
- A seasonally adjusted six percent of all owners reported higher nominal sales in the past three months. Consumer spending remains exceptionally strong and consistent with small business owners’ reports of positive sales trends.
“The August report does not show a sign of inflation or reflect what the Fed has noted,” said NFIB Chief Economist William Dunkelberg. “The pessimism we’re seeing is contagious, even though the actual economy is thriving. Expectations can be infected and, as a result, could turn sour. All the talk about an impending recession can create a false reality, but it doesn’t make it right. Main Street is continuing to produce and remains strong in spite of the headlines.”
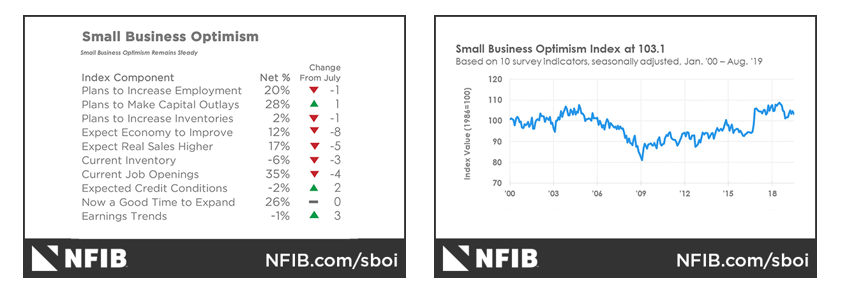
Image courtesy of NFIB
Consumer Price Index
The Consumer Price Index for All Urban Consumers (CPI-U) increased modestly during August-0.1% on a seasonally adjusted basis after rising 0.3% in July, according to the U.S. Bureau of Labor Statistics.
“Increases in the indexes for shelter and medical care were the major factors in the seasonally adjusted all items monthly increase, outweighing a decline in the energy index. The energy index fell 1.9% in August as the gasoline index declined 3.5%. The food index was unchanged for the third month in a row,” according to the report. “The index for all items less food and energy rose 0.3% in August, the same increase as in June and July. Along with the indexes for medical care and shelter, the indexes for recreation, used cars and trucks, and airline fares were among the indexes that increased in August. The indexes for new vehicles and household furnishings and operations declined over the month.”
Furthermore, the all items index increased 1.7% for the 12 months ending August. Below are some interesting figures, according to the latest data released by the U.S. Bureau of Labor Statistics.
- The 12-month increase has remained in the range of 1.5 to 2.0% since the period ending December 2018.
- The index for all items less food and energy rose 2.4% over the last 12 months, its largest 12-month increase since July 2018.
- The food index rose 1.7% over the last year while the energy index declined 4.4%.
Manufacturing ISM
Economic activity in the manufacturing sector expanded in August and the overall economy grew for the 124rd consecutive month, say the nation’s supply executives in the latest Manufacturing ISM® Report On Business®. The August PMI® registered at 49.1 percent, a decrease of 2.1 percentage points from the July reading of 51.2 percent.
The Report On Business measures its data using the Purchasing Manager’s Index (PMI), which is an indicator of economic health in the manufacturing sector. A reading above 50 percent indicates that the manufacturing economy is generally expanding, while below 50 percent indicates that it is generally contracting.
“Comments from the panel reflect a notable decrease in business confidence. August saw the end of the PMI® expansion that spanned 35 months, with steady expansion softening over the last four months. Demand contracted, with the New Orders Index contracting, the Customers’ Inventories Index recovering slightly from prior months and the Backlog of Orders Index contracting for the fourth straight month. The New Export Orders Index contracted strongly and experienced the biggest loss among the subindexes. Consumption (measured by the Production and Employment Indexes) contracted at higher levels, contributing the strongest negative numbers (a combined 5.6-percentage point decrease) to the PMI®, driven by a lack of demand,” said Timothy R. Fiore, CPSM, C.P.M., chair of the Institute for Supply Management® (ISM®) Manufacturing Business Survey Committee.
According to the report, inputs-expressed as supplier deliveries, inventories and imports-were again lower in August, due to inventory tightening for the third straight month and continued slower supplier deliveries. This resulted in a combined 1.5-percentage point decline in the Supplier Deliveries and Inventories indexes. Imports and new export orders contracted to new lows. Overall, inputs indicate (1) supply chains are responding better and (2) companies are continuing to closely match inventories to new orders, a positive sign for future expansion. Prices contracted for the third consecutive month, indicating lower overall systemic demand.
“Respondents expressed slightly more concern about U.S.-China trade turbulence, but trade remains the most significant issue, indicated by the strong contraction in new export orders. Respondents continued to note supply chain adjustments as a result of moving manufacturing from China. Overall, sentiment this month declined and reached its lowest level in 2019,” added Fiore.
Of the 18 manufacturing industries, nine reported growth in August: Textile Mills; Furniture & Related Products; Food, Beverage & Tobacco Products; Wood Products; Petroleum & Coal Products; Nonmetallic Mineral Products; Machinery; Miscellaneous Manufacturing; and Chemical Products. Seven industries reported contraction in August: Apparel, Leather & Allied Products; Fabricated Metal Products; Transportation Equipment; Primary Metals; Plastics & Rubber Products; Paper Products; and Electrical Equipment, Appliances & Components.
- Commodities Up in Price: Polypropylene; Scrap; and Steel- Hot Rolled*
- Commodities Down in Price: Aluminum (5); Aluminum Products (2); Caustic Soda; Corrugated Boxes (3); Natural Gas; Crude Oil; Pulp; Steel (2); Steel- Hot Rolled*; Steel Products* (8) and Steel- Stainless.
- Commodities in Short Supply: Electronic Components; and Helium (2).
*The number of consecutive months the commodity is listed is indicated after each item. *Indicates both up and down in price.
Imports and Exports
Imports: ISM®’s Imports Index registered 46% in August, a decrease of 1 percentage point when compared to the 47% reported for July, indicating that imports contracted in August for the second consecutive month. “Five of the six big industry sectors contracted, with none expanding during the period. The Imports Index reached its lowest level since December 2015 (46 percent),” said Fiore.
The four industries reporting growth in imports during the month of August include Furniture & Related Products; Textile Mills; Nonmetallic Mineral Products; and Miscellaneous Manufacturing. The 10 industries reporting a decrease in imports during August include Wood Products; Apparel, Leather & Allied Products; Petroleum & Coal Products; Plastics & Rubber Products; Electrical Equipment, Appliances & Components; Fabricated Metal Products; Food, Beverage & Tobacco Products; Machinery; Computer & Electronic Products; and Transportation Equipment.
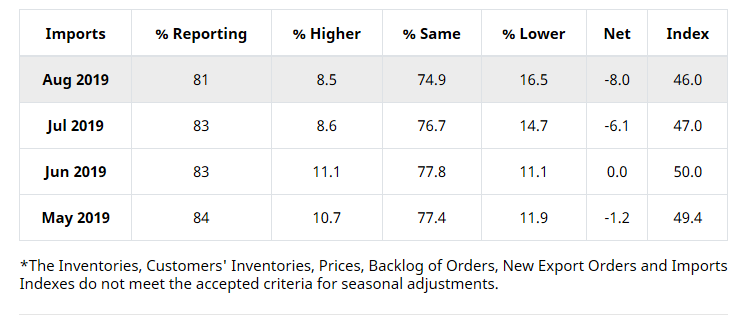
Image courtesy of the Institute for Supply Management
Exports: ISM®’s New Export Orders Index registered 43.3% in August, 4.8 percentage points lower compared to the July reading of 48.1%, indicating that new export orders contracted for the second month in a row. “The index had its lowest reading since April 2009 (42.9 percent). One of the six big industry sectors expanded, and four contracted during the period. Many respondents continued to note global trade softness as a reason for sluggish activity,” added Fiore.
The two industries reporting growth in new export orders during August include Furniture & Related Products; and Food, Beverage & Tobacco Products. The 10 industries reporting a decrease in new export orders include Petroleum & Coal Products; Apparel, Leather & Allied Products; Primary Metals; Fabricated Metal Products; Electrical Equipment, Appliances & Components; Paper Products; Transportation Equipment; Machinery, Miscellaneous Manufacturing; and Computer & Electronic Products. Six industries reported no change in new export orders in August as compared to July.
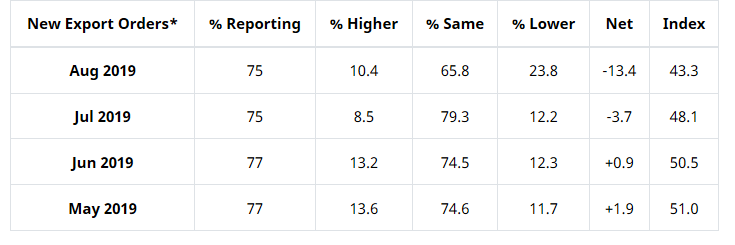
Image courtesy of the Institute for Supply Management