Key Performance Indicators Report – October 2019

State of the Economy
While many economic fundamentals remain solid, the September “SEMA Industry Indicators” report points to clear signs the economy is decelerating. The first half of the year delivered 2.6% growth relative to 3% growth in the first half of 2018. Specifically, second quarter economic growth—as measured by GDP—was unchanged at 2.0% in the third and final estimate. Based on these findings, the Fed has revised its forecast for the year down to 2.2% growth from 2.9% growth last year, which implies further slowing in the back half of the year.
Additionally, the Bureau of Labor Statistics reported The Consumer Price Index for All Urban Consumers (CPI-U) was unchanged during September on a seasonally adjusted basis after rising 0.1% in August. According to the report, the all items index increased 1.7% for the 12 months ending September, the same increase as for the 12 months ending August. The index for all items less food and energy rose 2.4% over the last 12 months, also the same increase as the period ending August. The food index increased 1.8% over the last year, while the energy index decreased 4.8%.
“This, in turn, makes us more susceptible to shocks and downside risks,” wrote Kyle Cheng of SEMA. “Consumer spending remains a bright spot. Yet, consumer sentiment saw its largest monthly decline since December 2012, in part because of concerns about tariffs. Consumers are taking note of growing risks on the horizon.
Lynn Franco, senior director of economic indicators at The Conference Board, added, “Consumer confidence declined in September, following a moderate decrease in August. Consumers were less positive in their assessment of current conditions and their expectations regarding the short-term outlook also weakened. The escalation in trade and tariff tensions in late August appears to have rattled consumers. However, this pattern of uncertainty and volatility has persisted for much of the year and it appears confidence is plateauing. While confidence could continue hovering around current levels for months to come, at some point this continued uncertainty will begin to diminish consumers’ confidence in the expansion.”
Take, for example, September new vehicle sales. Sure, a fluke in the calendar gave the Labor Day weekend to August, but add in the onset of a labor walkout at General Motors, the possibility of presidential impeachment hearings, as well as growing affordability issue for consumers and tough times ahead appear more realistic.
“As we look ahead, we’re really looking at what could be a very difficult quarter in so many ways, in the broader economy, from the geopolitical perspective, from a simple U.S. politics perspective,” predicted Jonathan Smoke, chief economist at Cox Automotive.
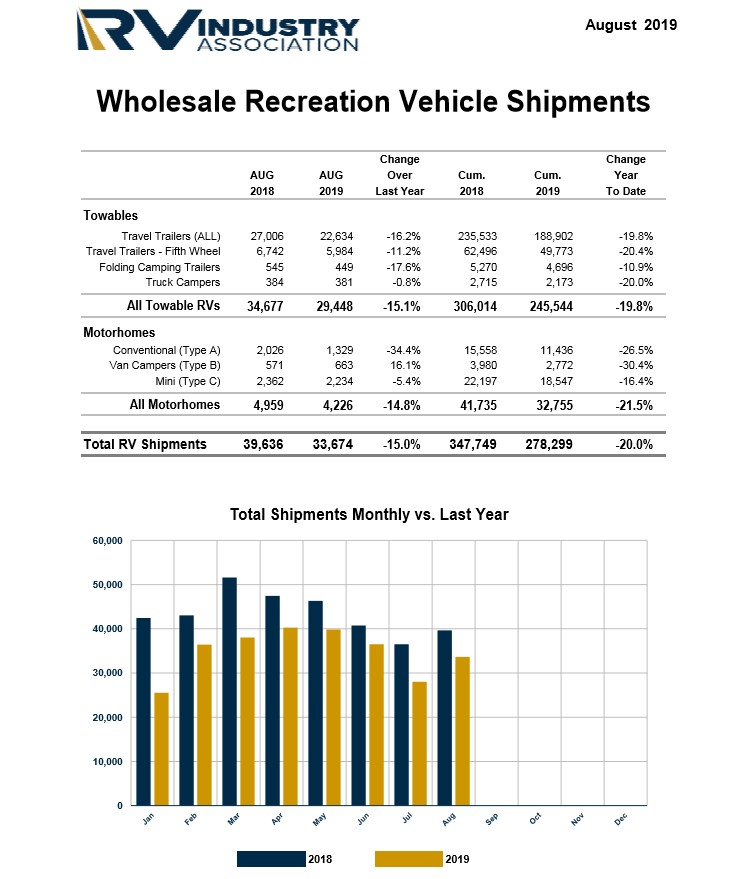
For example, the RV industry continues to be impacted, among others. Click here to read more about how this market traditionally has been a predictable indicator of economic health.
Additionally, the manufacturing sector and job market are beginning to simmer, mentioned Cheng. “While 130,000 jobs were added in August, approximately 34,000 are temporary census workers. Likewise, the three-month average private payroll growth over the last two months is at its lowest level since 2012,” he said.
Aside from overseas trade and manufacturing tensions, domestic concerns must be addressed as well. There are nearly as many registered vehicles in the U.S. as there are people, according to the Bureau of Labor Statistics. The estimated 770,100 automotive service technicians and mechanics, as of 2018, play a vital role in keeping the nation moving, but statistics tell a complex story of a workforce faced with ongoing challenges like exposure to hazardous contaminants, long hours and an unfair wage structure, which, over the years, has created a shortage of qualified technicians in the field.
- Automotive service technicians and mechanics who worked full time in the San Francisco-Oakland-Hayward, California, metropolitan area earned among the highest average hourly rates, $27.33 per hour. Full-time auto mechanics in the Scranton—Wilkes-Barre—Hazleton, Pennsylvania, metro area earned among the lowest wages, $15.87. Auto mechanics in Detroit-Warren-Dearborn, Michigan, averaged $22.18 per hour.
- By state, automotive service technicians and mechanics in Alaska earned among the highest wages, $27.00 per hour, while workers in West Virginia earned among the lowest hourly wages, $16.22. Automotive service technicians and mechanics in Michigan earned an average hourly wage of $20.63. The national average hourly wage for automotive service technicians and mechanics was $21.14. – Bureau of Labor Statistics
Click here for comprehensive coverage of the automotive technician shortage across America.
Unemployment Summary and Metropolitan Area Employment Status
On a positive note, September welcomed the lowest unemployment rate since December 1969. At 3.5%, the number of unemployed persons decreased by 275,000 to 5.8 million, according to the Bureau of Labor Statistics. As of August, Portland-South Portland, Maine reported the lowest unemployment rate at 1.7%, with the next lowest rates being Ames, Iowa and Burlington-South Burlington, Vermont at 1.9% each. Yuma, Arizona and El Centro, California continue to record the highest unemployment rates at 23% and 22.1% respectively.
Among major workforce groups, the unemployment rate for Whites and adult men declined to 3.2%, adult women to 3.1%, teenagers to 12.5%, Blacks to 5.5%, Asians to 2.5% and Hispanics to 3.9%.
Did you know? From 2018 to 2028, the Hispanic share of the labor force is projected to increase more than that of any other race or ethnic group, increasing from 17.5% in 2018 to 20.9% in 2028. From 2018 to 2028, the share for Hispanic men is projected to increase from 9.9% to 11.7%, while the share for Hispanic women is projected to increase from 7.5% to 9.2%.
As stated by Cheng and supported by The NFIB Research Foundation, “Job creation has faded steadily since February’s 0.52 workers per firm to 0.1,” with finding qualified workers to fill job openings hit a record high of 27% during August. The Small Business Index continues to rank this as a top problem.

Source: https://www.nfib.com/surveys/small-business-economic-trends/
Below is a current job sectors breakdown, courtesy of the Bureau of Labor Statistics:
- Employment in professional and business services is up +34,000. The industry has added an average of 35,000 jobs per month thus far in 2019, compared with 47,000 jobs per month in 2018.
- Employment in transportation and warehousing edged up in September (+16,000). Within the industry, job growth occurred in transit and ground passenger transportation (+11,000) and in couriers and messengers (+4,000).
- Employment in other major industries, including mining, construction, manufacturing, wholesale trade, information, financial activities, as well as leisure and hospitality showed little change month-over-month.
- Health care added 39,000 jobs, in line with its average monthly gain over the prior 12 months. Ambulatory health care services (+29,000) and hospitals (+8,000) also showed growth.
- Employment in government continued on an upward trend during the reporting timeframe (+22,000). Federal hiring for the 2020 Census was negligible (+1,000). Government has added 147,000 jobs over the past 12 months, largely in local government.
- Retail trade employment changed little in September (-11,000). Within the industry, clothing and clothing accessories stores lost 14,000 jobs, while food and beverage stores added 9,000 jobs. Since reaching a peak in January 2017, retail trade has lost 197,000 jobs.
New Vehicle Sales
No doubt, new vehicle sales are up against strong year-over-year numbers, with the overall new vehicle market down 1.1% this year. Coupled with an economy that is leveling out, continued global trade tensions and sedan sales that are bottoming out, it is no surprise that September sales figures show signs of cooling.
“We’re well below the strong growth rates we had during the early days of the market recovery and this is suggesting this affordability issue is really starting to eat away at consumers and they just aren’t able to keep up with the market,” said Charlie Chesbrough, Senior Economist at Cox Automotive.
As such, the September SAAR registered at 17.2 million, a decline from last year’s 17.3 million but up slightly from August’s 17.0 million rate. According to Manheim, retail sales of new vehicles were down 12% during September despite the highest average incentive in 21 months. This led to a retail SAAR of 14.6 million, a decrease from 14.8 million last September and the weakest retail SAAR over the last three months. New vehicle inventories came in under four million units for the fifth consecutive month but did increase month-over-month.
Light vehicle sales were 1,268,871 during the same timeframe, reflecting a 12% year-over-year decline. Slow sedan sales continue to have an impact, as car share was reported at 27%, but Mercedes-Benz USA was up 4.8% and BMW USA sales increased 6% year-over-year. While the automakers are expressing confidence 2019 will finish strong, the entire market continues to face challenges, such as the lingering labor strike at GM, the Damocles Sword of possible import tariffs and reactions from targeting countries, the possibility of U.S. presidential impeachment and consumer financial fatigue as the cost of new vehicles continues to escalate. The big story, however, is how strong fleet sales continue to support the new vehicle market despite all these factors—up 18% year-over-year, with overall fleet sales holding steady at a 5.8% increase through September 2019.
Automakers, by the Numbers
“While monthly U.S. car sales in 2019 declined each month through January to June, the drop had been relatively small. However, as September 2019 had fewer selling days than a year ago due to the Labor Day weekend, major automakers registered double-digit percentage sales decline,” explained Zacks Equity Research via Yahoo Finance, which provided the detailed automaker breakdown below.
- Hyundai’s U.S September sales fell 9% to 51,951 units, ending its 13-month streak of year-over-year monthly gains. The decline was due to lower volumes of Elantra and Sonata sedans.
- Subaru Corporation’s U.S. sales fell 9.4% from the comparable year-ago period to 51,659 units, snapping a streak of 93 consecutive monthly gains. Rapid sell-down of older-generation Legacy sedans and Outback crossovers ended the company’s winning streak after almost eight years.
- Toyota’s U.S. sales declined 16.5% year-over-year to 169,656 units, with deliveries falling for almost every model including Corolla, Camry, Pirus, RAV4, Land Crusier, Highlander, etc. Sales for both its namesake and Lexus brands tumbled in double digits percentages from the prior-year period to come in at 150,796 and 18,860 units, respectively. Reportedly, this marks the firm’s biggest decline in U.S. car sales volumes in eight years.
- Honda sales slid 14% from the corresponding period of 2018 to 113,925 units, after setting an all-time U.S. sales record in August. The decline marked the biggest fall since December 201. Notably, the company’s sales of cars and trucks declined 14.5% and 13.8%, respectively, from the year-ago period. While sales in the Honda division were down 13.7% to 102,827 units, Acura sales dipped 17.9% from the prior-year period to 11,098 units. Major models that saw a year-over-year decline in the month include Accord, Pilot and Civic.
- Nissan’s deliveries decreased 17.6% in the month to 101,244 units amid lower sales of Sentra sedans and Rogue SUVs. Sales for the Infinity luxury division plummeted 44% from the year-ago period.
According to Automotive News Data Centre estimates, U.S. auto sales for General Motors GM, Ford F and Fiat Chrysler FCAU also experienced a double-digit percentage drop in September but overall figures appear less daunting, as the companies now report on a quarterly basis instead of monthly. The following information is courtesy of Zacks Equity Research via Yahoo Finance:
- “General Motors’ sales for the period of July to September increased 6.3% from the prior-year period to 738,638 deliveries. The company reported increased sales across all leading brands including Chevrolet, Buick, GMC and Cadillac. While sales from Chevy rose 4.6% to 507,273 units, GMC registered 11.4% year-over-year growth to 140,789 vehicles. Buick and Cadillac scaled up 10.2% and 7.2% year over year to 50,615 and 36,961 deliveries, respectively. The company ended the quarter with 759,633 units of inventory, which will be monitored closely as the strike with UAW has completed its 17th day.”
- “Ford’s total vehicle sales in the United States declined 4.9% year over year to come in at 580,251 in third-quarter 2019, as the firm trimmed sedans from the Ford brand. The decline primarily resulted from lower sales of cars and SUVs, partially offset by higher truck sales. The firm’s truck sales rose 8.8% in the quarter, thanks to Ranger pickups. Third-quarter pickup sales of 240,387 marked the company’s best performance in 14 years. While SUVs and car sales declined 10.5% and 29.5%, respectively, Ford van sales hit an all-time record in the quarter, up 21% from 65,288 units a year ago. Ford Transit and Transit Connect were responsible for the record van sales. Notably, Lincoln SUVs reported best third-quarter sales performance in 16 years.”
- “FCA’s Q3 sales were flat with the July-September period a year ago but reported record quarters for the Jeep Wrangler and Ram pickup trucks. In a bit of an anomaly, Dodge muscle cars bucked the trend away from passenger cars with Challenger and Charger reporting third quarter boosts of 24% and 46% respectively.”
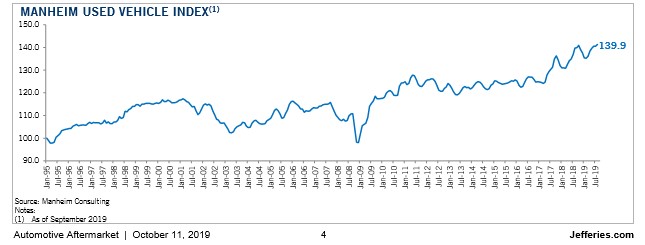
Manheim Used Vehicle Index
According to Cox Automotive, total used vehicle sales volume dipped 0.1% year-over-year during September. Wholesale used vehicle prices (on a mix-, mileage- and seasonally adjusted basis) decreased 1.04% month-over-month, which brought the Manheim Used Vehicle Value Index to 139.9—flat from a year ago and an off the record high for the Index.
Manheim put the September used SAAR at 39.8 million, an increase from 39.7 million last September and flat in comparison to the reported August rate. Furthermore, the September used retail SAAR estimate is 20 million, a bump from 19.6 million last September and flat month-over-month.
“Weekly Manheim Market Report (MMR) prices showed increasing depreciation as September progressed. The majority of the summer had low depreciation, before the accelerating depreciation pattern marked an abrupt shift in season. The weekly pattern most resembled the pattern from last October, when prices began to normalize following an abnormally strong summer and early fall. Three-year-old vehicle values in aggregate were down 2.6% for the month, when prices normally decline by 1.5%. As a result of this higher depreciation, prices in aggregate in non-luxury ended lower than the beginning of the year for the first time since March,” explained Manheim.
Luxury cars and vans were the top performers, while most other major segments underperformed the overall market. Manheim reported, “Last year continues to be a tough comparison for both prices and sales as we experienced an abnormal increase in consumer demand driven by tariff fears and rising interest rates.”
Automotive Aftermarket KPI
New vehicle sales may have simmered, but the aftermarket remains red hot. “Pickup upgrades are the largest sector of the specialty-equipment industry, accounting for 27% of total retail dollars, followed by mid-range cars and SUVs (including the Jeep Wrangler). This aligns with the composition of vehicles on the road,” said Kyle Cheng of SEMA. “However, the industry is large, offers a wide array of different products, and customer interests vary. As such, sales for all vehicle types contribute to the overall market. The specialty-equipment industry continues to grow at a fast pace. Last year, American consumers spent $44.6 billion on specialty aftermarket parts. SEMA projects that the market will continue to grow through the end of 2019 and bring retail sales close to a new high of nearly $46 billion,” he added.
Also worth noting: the rise of powersports as a legitimate source of revenue for traditional automotive aftermarket shops. According to CDK Global Recreation, per the most current issue of Powersports Business, 54% of side-by-sides are now leaving dealerships with an accessory attached as part of the unit purchase.
The latest exclusive data from CDK Global Recreation shows that multi-purpose UTVs are being sold with an accessory added at the time of the unit purchase at rate of 57 percent of the time. This study focuses on 133,000 Multi-Purpose UTV units that were sold between Aug. 1, 2018 and July 31, 2019. Examples of some of the units included in this study are the Can-Am Defender Max TEX HD10, Honda Pioneer 1000-5 DLX, Polaris Ranger XP 1000 EPS and Kawaski Teryx4 LE. This study only includes units where the VIN number can be decoded to identify the exact make, model, product line and segment. OEMs that do not provide specific VIN decoding were not included. – Powersports Business
The SHOP Magazine conducts annual coverage of the powersports industry and the many opportunities it provides automotive aftermarket shops. Read 2019 coverage here and here.

A snapshot of the powersports industry by region, courtesy of Powersports Business.
Industry Events
SEMA: The Annual Specialty Equipment Market Association (SEMA) Show: SEMA is the must-attend event across the industry. From Nov. 5–8, 2019 in Las Vegas, industry professionals across the spectrum of wheel, tire, racing, performance, audio, paint, collision repair, vehicle care and tool products for street rods, hot rods, sport compacts, exotics, trucks, ATVs and UTVs join together for a trade show experience unlike any other.
The finalists have been announced for three of SEMA’s prestigious industry awards—SEMA Rep Agency of the Year, SEMA WD of the Year and SEMA Manufacturer of the Year. The awards will be presented during the SEMA Industry Awards Banquet, Thursday, November 7. Click here for details.
Auto Conference LA
November 19, 2019
The L.A. Grand Hotel Downtown
This half-day event features highly-qualified industry speakers, panel discussions on the future of the global auto industry, an economic briefing and much more. From the future of retail and harnessing the power of digital to trade and tariff discussions, Auto Conference LA is a must-attend event for those across the automotive industry. Below are some highlights from the speakers:
Panel Discussion—Harnessing the Power of Digital: In this session, panelists will discuss the ever-evolving automotive digital landscape. They will share best practices in harnessing digital tools to reach consumers and breakthrough the clutter. Panelists will also reflect on how they individually entered the automotive sector and what advice they would offer to attract more woman to this exciting industry.
San Francisco Fed Discussion on Trade/Tariffs: Dr. Glick will present his views on the current outlook for the U.S. economy, including the headwinds from weaker global growth, trade tensions, and policy uncertainty.
The China Factor – 2.0: Between now and 2025. look for China’s automakers to push out into global markets via exports and direct investments. Two factors driving the global offensive: slower market growth at home and much improved product quality and technology.
Full agenda: http://www.autoconferencela.com/agenda
Speaker list: http://www.autoconferencela.com/speakers
To register: http://www.autoconferencela.com/registration

Manufacturing ISM
Economic activity in the manufacturing sector contracted in September, and the overall economy grew for the 125th consecutive month, according to the nation’s supply executives in the latest Manufacturing ISM® Report On Business®. The September PMI® registered at 47.8 percent, a decrease of 1.3 percentage points from the August reading of 49.1 percent.
The Report On Business measures its data using the Purchasing Manager’s Index (PMI), which is an indicator of economic health in the manufacturing sector. A reading above 50 percent indicates that the manufacturing economy is generally expanding, while below 50 percent indicates that it is generally contracting.
“Comments from the panel reflect a continuing decrease in business confidence. September was the second consecutive month of PMI® contraction, at a faster rate compared to August. Demand contracted, with the New Orders Index contracting at August levels, the Customers’ Inventories Index moving toward ‘about right’ territory and the Backlog of Orders Index contracting for the fifth straight month (and at a faster rate). The New Export Orders Index continued to contract strongly, a negative impact on the New Orders Index. Consumption (measured by the Production and Employment indexes) contracted at faster rates, again primarily driven by a lack of demand, contributing negative numbers (a combined 3.3-percentage point decrease) to the PMI® calculation,” said Timothy R. Fiore, CPSM, C.P.M., Chair of the Institute for Supply Management® (ISM®) Manufacturing Business Survey Committee.
According to the report, inputs—expressed as supplier deliveries, inventories and imports—were lower during September. This was mainly due to inventory tightening for the fourth straight month, which resulted in a combined 3.3% decline in the Supplier Deliveries and Inventories indexes. Important takeaways suggest imports contraction slowed and inputs indicate supply chains are meeting demand and companies are continuing to closely match inventories to new orders. Furthermore, prices decreased for the fourth consecutive month, but at a slower rate.
“Global trade remains the most significant issue, as demonstrated by the contraction in new export orders that began in July 2019. Overall, sentiment this month remains cautious regarding near-term growth,” Fiore added.
Of the 18 manufacturing industries, three reported growth in September: Miscellaneous Manufacturing; Food, Beverage & Tobacco Products; and Chemical Products. The 15 industries reporting contraction include Apparel, Leather & Allied Products; Printing & Related Support Activities; Wood Products; Electrical Equipment, Appliances & Components; Textile Mills; Paper Products; Fabricated Metal Products; Plastics & Rubber Products; Petroleum & Coal Products; Primary Metals; Transportation Equipment; Nonmetallic Mineral Products; Machinery; Furniture & Related Products; and Computer & Electronic Products.
- Commodities Up in Price: Natural Gas; Precious Metals
- Commodities Down in Price: Aluminum; Base Oil; Corrugated Boxes; High-Density Polyethylene; Nylon; Pulp; Scrap; Steel; Steel—Hot Rolled; and Steel Products
- Commodities in Short Supply: Castings; Electronic Components; and Helium
*The number of consecutive months the commodity is listed is indicated after each item. *Indicates both up and down in price.
Exports
ISM’s New Export Orders Index registered 41% in September, 2.3 percentage points lower compared to the August reading of 43.3%, indicating that new export orders contracted for the third month in a row. “The index had its lowest reading since March 2009 (39.4%). One of the six big industry sectors expanded, and five contracted during the period. Many respondents continued to note global trade softness as a reason for sluggish activity,” said Fiore.
The two industries reporting growth in new export orders in September are Food, Beverage & Tobacco Products and Miscellaneous Manufacturing. The 11 industries reporting a decrease in new export orders include Apparel, Leather & Allied Products; Petroleum & Coal Products; Textile Mills; Fabricated Metal Products; Nonmetallic Mineral Products; Computer & Electronic Products; Transportation Equipment; Plastics & Rubber Products; Paper Products; Machinery; and Chemical Products.
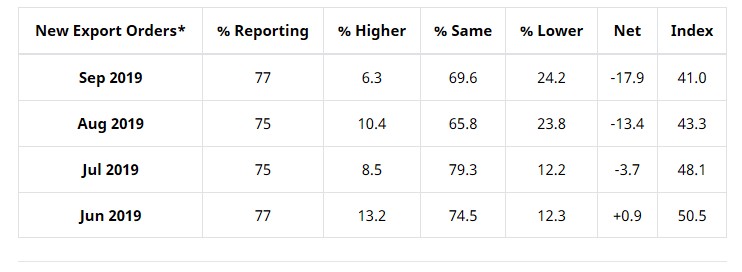
Image Courtesy ISM
Imports
ISM’s Imports Index registered 48.1% in September, an increase of 2.1 percentage points when compared to the 46 reported for August, indicating that imports contracted in September for the third consecutive month. “Five of the six big industry sectors contracted, with one expanding during the period. Imports Index contraction slowed during September,” explained Fiore.
The two industries reporting growth in imports during the month of September are Petroleum & Coal Products and Nonmetallic Mineral Products. The 11 industries reporting a decrease in imports include Apparel, Leather & Allied Products; Paper Products; Plastics & Rubber Products; Electrical Equipment, Appliances & Components; Fabricated Metal Products; Computer & Electronic Products; Miscellaneous Manufacturing; Machinery; Transportation Equipment; Chemical Products; and Food, Beverage & Tobacco Products.