Key Performance Indicators Report – November 2019

‘Tis that time of year again—the holidays are upon us. From Black Friday, Small Business Saturday and Cyber Monday to Super Saturday and everything in-between, consumers are ready to shop until they drop. Nostalgia, excitement and joy may be riding high but for retailers who rely on solid October, November and December sales to carry them through the lull of the New Year, this time of year is all business—and it takes a significant amount of planning and prepping to make the upcoming selling season a successful one, from developing a solid sales plan and creating an attractive and inviting storefront to securing seasonal inventory and crafting custom in-store promotions.
A Look at the Numbers
Holiday retail sales across the U.S. were forecast to reach 729.3 billion in 2019, according to Statista. Though holiday retail sales are a fraction of total retail sales in the United States, which were around 5.5 trillion U.S. dollars in 2019, sales this time of year have risen substantially since the turn of the century, as shown in the graph below.
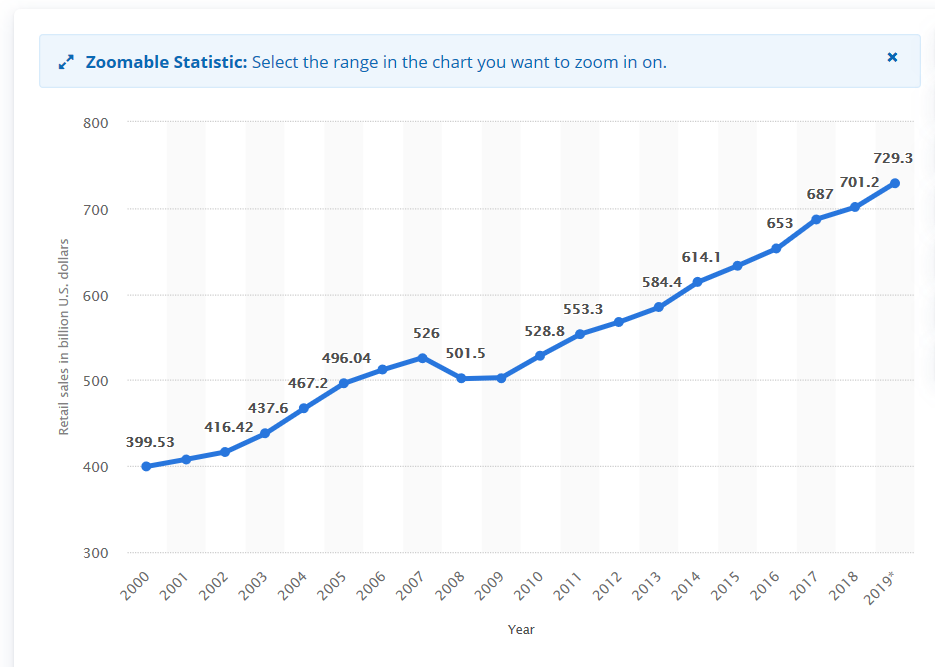
Image Courtesy of Statista
Holiday season e-commerce is also on the rise, with an increasing number of retailers and consumers seeking digital solutions. In fact, e-commerce holiday season sales are projected to reach 135.35 billion U.S. dollars this year, an increase of 13.2 percent compared to the previous year.
“Despite complaints from some about the commercialization of Christmas, the practice of spending on gifts for family and friends has a strong presence and is the cultural norm in the United States. However, one practice that is changing is where shoppers are going to do their Christmas shopping. Annual holiday season retail e-commerce sales growth in the United States shows that online shopping during the holiday season is growing at a rate higher than that of total retail sales as seen above. As such, local retailers are concerned that more shoppers are choosing to shop from home or on-the-go through their mobile devices,” explained Statista.
Tips for a Successful Holiday Season
According to a recent survey regarding the most important factors influencing a consumer’s decision to shop retail during the holiday season, price discounts and selection of merchandise rank the highest.
“Local retailers may find it increasingly difficult to compete with the prices and selection offered online given the ability of large online platforms to harness the benefits of economies of scale and wide market access. However, there is hope for local retailers,” stated Statista. Holiday Shoppers Want the Full Experience:
- “We start talking about the holidays in early September and put together our store flyer by early October. We look at previous year sales, as well as new items and widgets in every price range, including gifts under $25 and $50. Then we adjust store inventory based on that information,” said Rudy Forlenza, industry veteran of 40 years and General Manager of 19 A&A Auto stores located in northeastern, Pennsylvania.
- Help make it an enjoyable retail experience by creating an engaging first impression. Greet consumers with a clean, organized and presentable storefront that captures interest. Showcase an appropriate mix of holiday décor and seasonal products. Focus on the appropriate combination of new and top selling products/applications, seasonal favorites, impulse buys and clearance or discounted items.
- Entice them to step inside and spend. “The store displays, such as end caps, display tables, gift guides and holiday flyers should be placed in high-traffic areas,” said Forlenza.
- Infuse an effective use of color, lighting, music, product segmentation, display and demonstration, directional signage, as well as aisle presentation—all of which influence consumer perspective and are effective tools in converting window shopping to actual sales.
- Drum excitement for the upcoming holiday season by launching an online contest, allowing for the collection of consumer contact information so they can be entered to win a prize.
- Paul Breton, owner of Car-risma in Massachusetts, advertises holiday specials on the shop website, communicates deals and product selection with customers via social media, and starts to hang up the Christmas decorations right after Halloween. Be creative: “We do a good business in remote car starters during fall. We save all those boxes and then do a remote starter tree display (by the toy soldier) for the holidays,” said Breton.
State of the Economy
Recently, the Department of Commerce’s Bureau of Economic Analysis (BEA) announced that real gross domestic product (GDP) increased at an annual rate of 1.9% and consumer spending grew 2.9% during the third quarter.
Spending on durable goods led the way, jumping 7.6% in comparison to the second quarter. Business intellectual property investment rose 6.6%, “signaling that American business will continue to lead the world with new ideas and inventions. The 1.6% growth in goods exports demonstrates that [the administration’s] trade policies are bringing Made in America back,” according to the report.
Furthermore, the Consumer Price Index for All Urban Consumers (CPI-U) rose 0.4%, according to the Bureau of Labor Statistics. The all items index increased 1.8% year-over-year, a modest increase in comparison to the month prior. Important takeaways:
- The energy index increased 2.7% after recent monthly declines and accounted for more than half of the increase in the seasonally adjusted all items index—increases in the indexes for medical care, recreation and food also contributed.
- The gasoline index rose 3.7% and the other major energy component indexes also increased.
- The food index rose 0.2%, with the indexes for both food at home and food away from home increasing during the month.
- Along with the indexes for medical care and recreation, the indexes for used cars and trucks, shelter and personal care all experienced a boost as well.
- The apparel index declined in October, as did the indexes for household furnishings and operations, new vehicles and airline fares.
Unemployment Summary and Metropolitan Area Employment Status
The unemployment rate was little changed from the 50-year record low in September 2019, coming in at 3.6%. Recent data shows Ames, IA and Charleston-North Charleston, SC with the lowest unemployment rates at 1.5% each. In contrast, El Centro, CA and Yuma, AZ had the highest unemployment rates at 20.7% and 18.6% respectively. Florence, SC, reported the largest year-over-year unemployment rate decrease at -1.7 percentage points, while 27% of other areas experienced rate declines of at least 1%. The largest year-over-year rate increase occurred in Jackson, MS at +1.1 percentage points.
A total of 189 areas reported jobless statistics above the U.S. rate of 3.3%, 184 areas had rates below it and 16 areas had rates equal to that of the nation.
Among major workforce groups, the unemployment rate is as follows: Blacks/African Americans – 5.4%, Hispanics/Latinos – 4.1%, Whites – 3.2% and Asians – 2.9%.
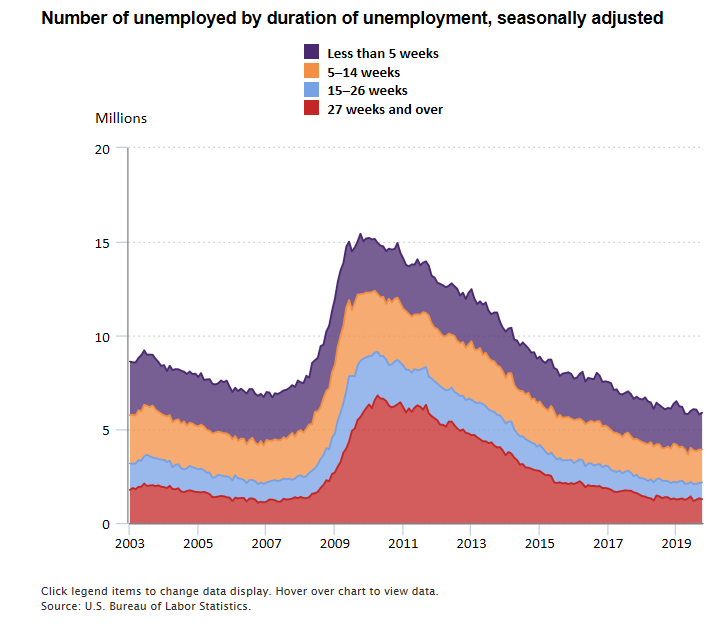
Image Courtesy of the Bureau of Labor Statistics
The national unemployment rate remains low but to some industry insiders, recent reports also provide evidence of a slower, though stabilizing economy. “Job creation slowed to 128,000 when analysts had expected only 85,000, and the prior two monthly numbers were revised up for a net increase of 95,000 more jobs than originally estimated,” added Manheim. These new jobs bring the total to 6.3 million new jobs since January 2017. Important takeaways include the following:
- Employment in health care increased 2.5% year-over-year, while employment in social assistance increased 3.5%.
- Leisure and hospitality employment increased by 2.4% over the same 12 months, with most jobs added in accommodation and food services.
- Employment increased 1.9% in professional and business services and 1.3% in financial activities during the same time period.
- Employment in mining and logging, utilities and retail trade showed little or no change year-over-year.
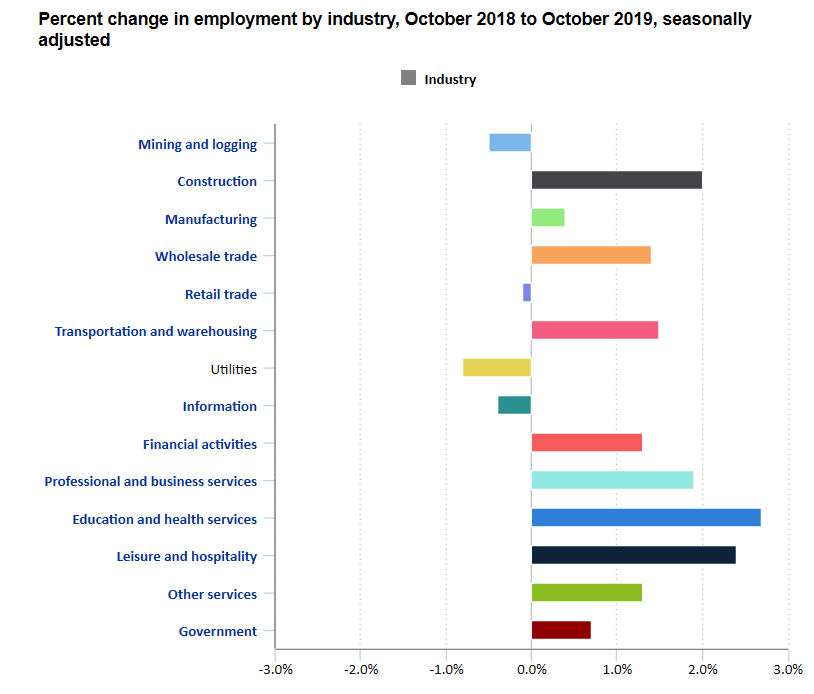
Image Courtesy of the Bureau of Labor Statistics
Worrisome for the automotive industry is the percentage of households reporting plans to purchase a vehicle during the next six months–the lowest in four years.
New Vehicle Sales
Even with one more selling day in comparison to October 2018, total new vehicle sales were down 1.8% year-over-year. The most recent SAAR registered at 16.5 million—not only a decline from last year’s 17.5 million, but also a decrease from September’s 17.1 million rate.
Total deliveries may have risen 2.5% from a year ago to 1.39 million, benefiting in part from one extra selling day, according to a joint estimate from J.D. Power and LMC Automotive. The forecast works out to a seasonally adjusted annualized rate of 17.3 million vehicle sales, down about 200,000 units from a year ago. –Bloomberg
Though “after an extremely volatile light vehicle market during the first half of the year, where the SAAR had months with nearly one-million-unit swings, the market has settled into a relatively stable pace of nearly 17 million since May,” according to Cox Automotive.
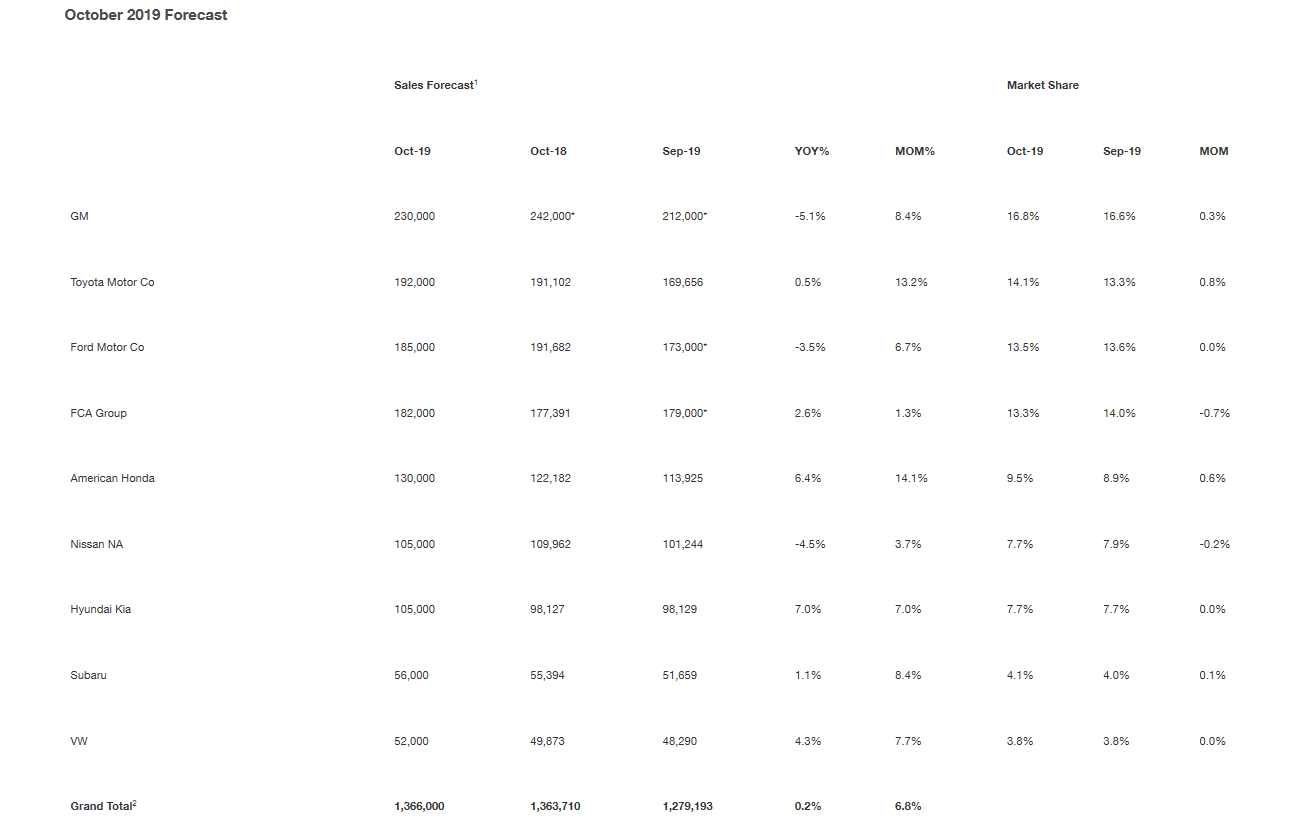
Image Courtesy of Cox Automotive
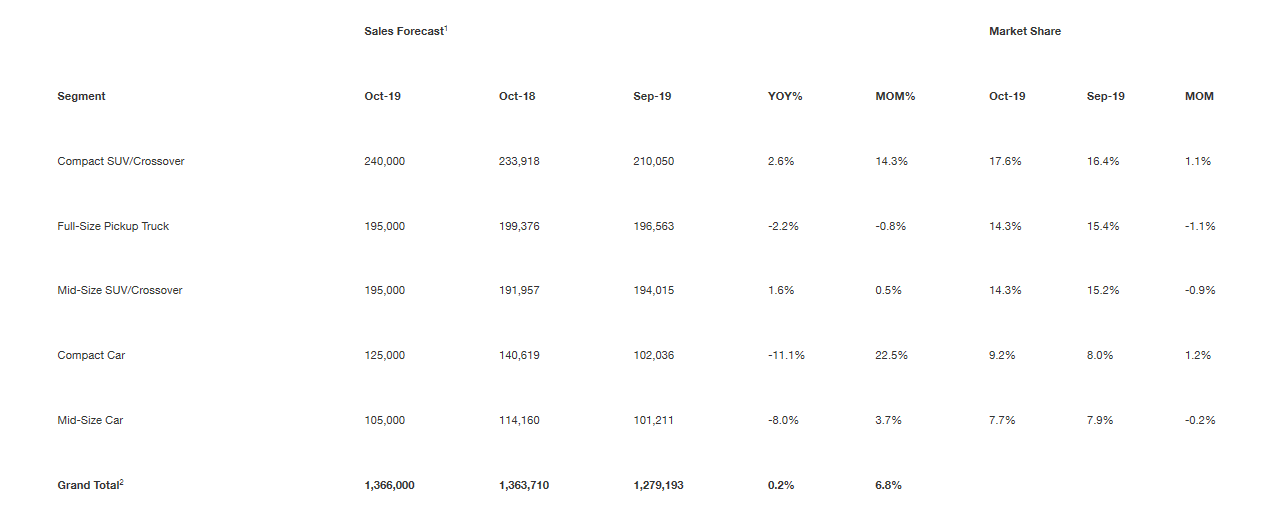
Image Courtesy of Cox Automotive
Cox Automotive points out affordability issues—a result of high interest rates and high vehicle prices— are leaving many potential new vehicle buyers out of the market. “Worsening economic news and aggressive fleet activity earlier in the year suggests some pull-back should be expected.”
Indeed, strong fleet sales have supported the new vehicle market during 2019, but growth is stabilizing. “Combined rental, commercial and government purchases of new vehicles decreased 10.8% year-over-year in October. The commercial fleet channel was particularly strong, up 17% year-over-year last month. Retail sales of new vehicles were down 0.2%, leading to a retail SAAR of 14.3 million, which is down from 14.9 million last October and the weakest retail SAAR over the last four months. Fleet sales are up 4.3% in 2019 through October, and retail sales are down 2.3%, as the overall new vehicle market is down 1.2% this year,” reported Manheim.
The dip in sedan sales continues to impact the industry, as car share in October was 26%, which is the lowest percentage on record. “With buyers shifting from sedans to more expensive sport utility vehicles and pickups, the average transaction price for new models is expected to top $34,000 for the first time ever, rising almost $1,300 from a year ago. Even so, intense competition is forcing automakers to lure buyers with generous incentives, which are projected to exceed $4,000 per vehicle, as the industry struggles to move record levels of old model-year inventory off dealer lots,” reported Bloomberg.
Image Courtesy of Jefferies Weekly Global Automotive Aftermarket Report
Automakers, by the Numbers
Detroit’s three major manufacturers no longer are reporting monthly numbers, so tallies for October do not include official figures from General Motors Co., Ford Motor Co. or Fiat Chrysler Automobiles NV. “Other automakers, mostly foreign brands, generated about 56% of U.S. new vehicle sales in the first half of the year,” according to Edmunds. Automaker data courtesy of Bloomberg:
- Subaru of America reported a new all-time record for October, a top selling month for Ascent and the “best month ever” for Crosstrek. Additionally, Subaru celebrated 75 consecutive months of more than 10,000 Foresters sold, as well as 68 consecutive months of more than 10,000 Outbacks sold.
- Honda Motor Co.’s 7.6% gain to 131,443 cars and trucks was driven by some of its most diminutive models. Deliveries doubled for the HR-V crossover and tripled for the Fit subcompact.
- South Korean automaker Hyundai Motor Co. had a banner month with sales up 8.4% to 57,094 vehicles, paced by demand for its Santa Fe and new Palisade SUVs. The brand resumed its growth trajectory after hitting a speed bump in September, the first month in more than a year it saw sales decline.
- Toyota Motor Corp. had a bit of an anomalous month for an era where pickups and utility vehicles are king. Sales fell for both the Tacoma and Tundra truck models, as well as the Highlander SUV. Total deliveries dipped 1.2% to 188,787, but global sales remain strong. Read more here.
- Nissan Motor Co. deliveries fell for the fourth time in the last month, sliding 5.8% to 103,563.
- The Infiniti luxury brand has been weighing on the company’s numbers all year, and the trend continued into October with sales plunging 23%. The only models in the lineup that didn’t drop were the Q50 sedan and QX60 crossover.
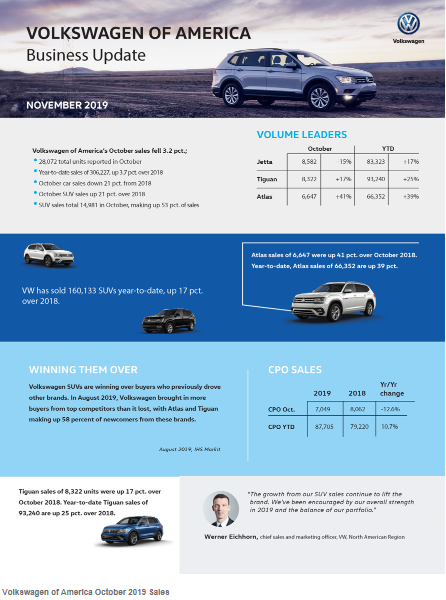
Image Courtesy of Volkswagen
Manheim Used Vehicle Index
Wholesale used vehicle prices (on a mix-, mileage- and seasonally adjusted basis) saw a modest increase of 0.29% during October. This brought the Manheim Used Vehicle Value Index to 140.3, which is a 0.4% decrease from a year ago, and the first year-over-year decline for the Index in 33 months.
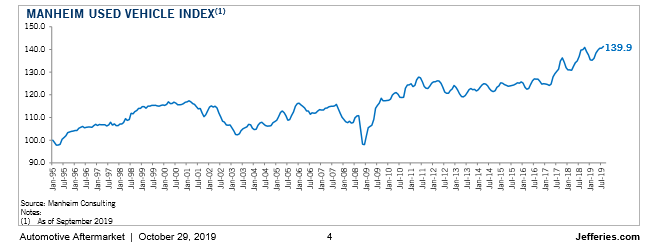
Image Courtesy of Jefferies Weekly Global Automotive Aftermarket Report
“Weekly Manheim Market Report (MMR) prices continued to exhibit an accelerating depreciation pattern that began in September and peaked midway through October. Three-year-old vehicle values in aggregate were down 4% for the month, when prices normally decline by 1.5-2%. The above-average depreciation trend occurred in all major market segments. As a result of this higher depreciation, prices in aggregate relative to the beginning of the year are now lower than either of the last two years,” explained Manheim.
Most major market segments experienced year-over-year seasonally adjusted price declines during October. The exception: luxury cars outperformed the overall market. “Last year, especially October, continues to be a tough comparison for prices as we reached a record in the Manheim Index because of abnormally strong consumer demand in the fall related to tariff fears and rising interest rates. A year ago, dealers were willing to spend a record amount for used vehicle inventory to take advantage of very strong new and used vehicle demand,” according to the report.
Manheim estimates the October used SAAR to be 39.6 million, up from 38.1 million last October and down from September’s 39.8 million rate. The October used retail SAAR estimate is 20.6 million, up from 19.8 million last year and slightly up month-over-month from September’s 20 million rate.
Automotive Aftermarket KPI
In a recent SEMA e-News, Matt Kennedy explored the diverse challenges of automotive retail. “The specialty-automotive aftermarket industry has always been driven by adaptation and innovation. It’s not just the products that are constantly changing, either; the ways specialty parts are bought and sold are also evolving over time. Today, the independent retailers that sell our industry’s products to consumers are dealing with a business environment that’s changing just as much as the parts they carry,” he explained.
The new SEMA Retail Landscape Report takes a more strategic look at the ways in which retailers are facing and adapting to a variety of business challenges. “Increased online competition and its effect on consumer expectations and behavior are certainly key shifts with a widespread impact on retail. But there’s more to it than just the growth of online sales,” explained Kennedy. Retailers, as well as those companies wanting to understand specialty-automotive retail better, will find the report beneficial:
- What is the current state of affairs for specialty automotive retail?
- How do retailers feel the industry and customer base have changed?
- How can small retailers stand out from bigger, cheaper competitors?
- What opportunities are there for retailers to become more efficient?
- What factors do retailers think will shape the industry going forward?
Despite many challenges, 83% of automotive specialty-equipment retailers have reported stable or growing sales in recent years, according to SEMA. Such a high percentage should lessen fears of a downward spiral of retail business. More than 3,000 SEMA-member retailers are primed for continued growth, as was apparent at the recent 2019 SEMA Show.
“The internet and e-commerce are becoming normal aspects of doing business, with many specialty automotive retailers selling products online or using the internet to advertise and promote themselves. However, retailers surveyed reported that most 2018 sales were made through in-store purchases and believed that offering personalized advice to their customers was the key to helping them succeed in the future,” explained Ashley Reyes of SEMA.
According to Gavin Knapp, SEMA director of Market Research, “The SEMA Retail Landscape Report shows that the heavily publicized death of traditional retail is greatly exaggerated. The positive news is that most retailers in our industry are doing well. While the internet and e-commerce have impacted their businesses, savvy retailers are learning how to incorporate online sales into the mix and finding great success,” Gavin continued.
A few takeaways, courtesy of Reyes:
- For specialty-automotive retailers who find opportunity online, 54% sell products through their company’s website and 39% sell their products through an online marketplace, such as Amazon, eBay and Walmart.
- The web and social media are vital for marketing with 81% of retailers using social media to market their businesses. Facebook and Instagram are the main—but by no means the only—platforms used, while 71% of specialty auto retailers use their company’s website to advertise their business.
Image Courtesy of Jefferies Weekly Global Automotive Aftermarket Report
Powersports
One market segment that continues to infuse excitement into the traditional automotive aftermarket is a growing interest in powersports, and the tremendous crossover potential it presents traditional shop owners. Below is a dealer financial snapshot, providing readers with a “health check” per region.
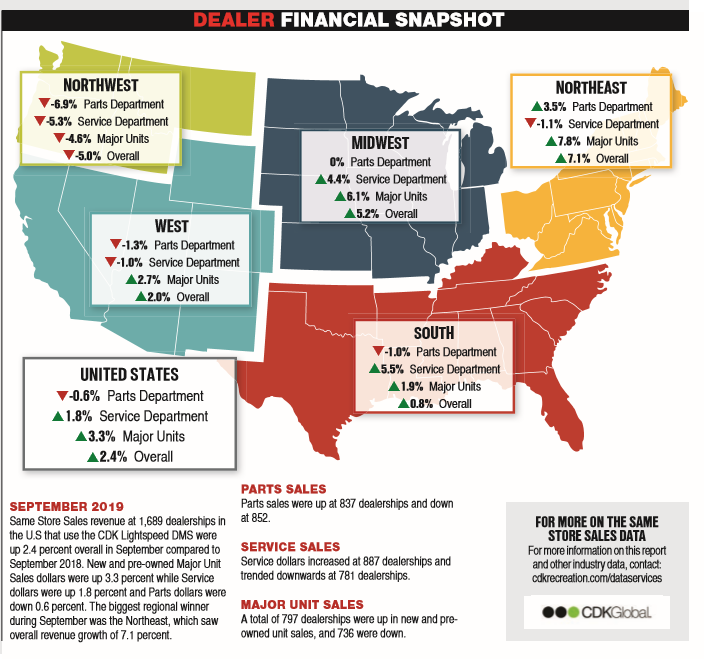
Image Courtesy of Powersports Business, November Edition
Though side-by-side (SxS) and ATV units are of upmost interest to many automotive aftermarket shop owners, 1) we are in the midst of winter, which is primetime for snowmobile sales and, as recently reported in THE SHOP Magazine, 2) major manufacturers like Polaris and BRP have been posting increased unit sales in the snowmobile category during the past year—spelling opportunity for business owners in key regions that are ripe for sales.
The 2019-2020 snowmobiling season is underway. To help make the most of the selling season, the International Snowmobile Manufacturers Association is prepping shop owners with interesting data points about target demographics:
- Approximately 79% of snowmobilers are male.
- Snowmobilers come in all ages. Though the average snowmobiler is 45 years old.
- The average snowmobiler in the 2018−2019 season rode 1,500 miles/2,414 kilometers (a 20% increase in ridership compared to 2017−2018.) The number of miles ridden, on average, is dependent on snow cover, so we will see if Mother Nature brings us more days of snow for riding this season.
- Many snowmobilers belong to a club and participate in many of their club’s events.
- About half of the people who snowmobile, trailer their snowmobile to their riding area. The other half ride from their home or cabin.
- Snowmobiling is a family-friendly activity. Most of all those responding to surveys report that they snowmobile with family, friends and club members.
- Snowmobilers are outdoor recreationists all year round. Following is a list of recreational activities that snowmobilers participate in when they aren’t out riding: 60%—ATV riding; 57%— camping; 54%—fishing; 53%—boating; 38%—hunting; 35%—hiking; 32%—motorcycle riding; 26%—golfing; 17%—personal watercraft riding; 15%—downhill skiing; and 15%—other recreational activities.
- Snowmobilers are a big part of the winter economic engine by spending an average of $3,349 each year going snowmobiling, traveling to their snowmobiling spot, as well as food, gas and lodging. In many places of North America, snowmobilers pay the bills for people involved in the winter tourism industries and related businesses.
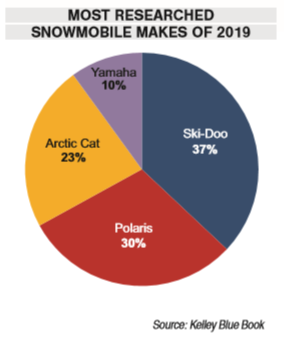
In its most recent edition, Powersports Business published exclusive data provided by Kelley Blue Book regarding the most researched snowmobiles on www.KBB.com from January 2019 – August 2019.
Eight of the top 10 most researched snowmobiles during the time period are manufactured by Polaris, with Ski-Doo securing the other two spots.
“The No. 1 snowmobile on the list, the 2018 Polaris 120 Indy, received significantly more KBB.com traffic than the No. 2 snowmobile on the list, the 2016 Polaris 800 Pro RMK 155. Seven of the top 10 snowmobiles were in the 800−850cc range. Only two of the snowmobiles in the top 10 were more than 10 years old, the 2006 Polaris 600 HO Fusion and the 1999 Polaris Indy 500. Last year, the top 10 list included six snowmobiles over 10 years old,” explained Powersports Business.
“Despite Polaris’ dominance in the top 10 most researched snowmobiles list, it was Ski-Doo that garnered the greatest share of KBB.com traffic for snowmobiles overall at 37%. Polaris was second at 30%. Both Ski-Doo and Polaris received a greater share of KBB.com traffic for 2019 year-to-date than they garnered a year ago. Arctic Cat and Yamaha both dropped 2%,” continued Powersports Business.
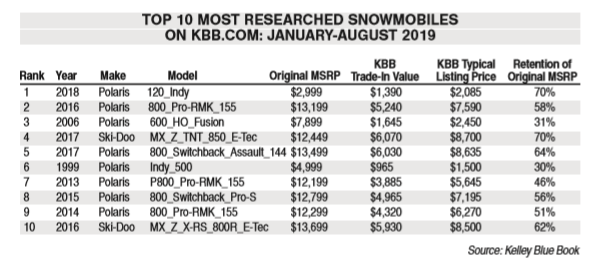
Image Courtesy of Powersports Business, November Edition
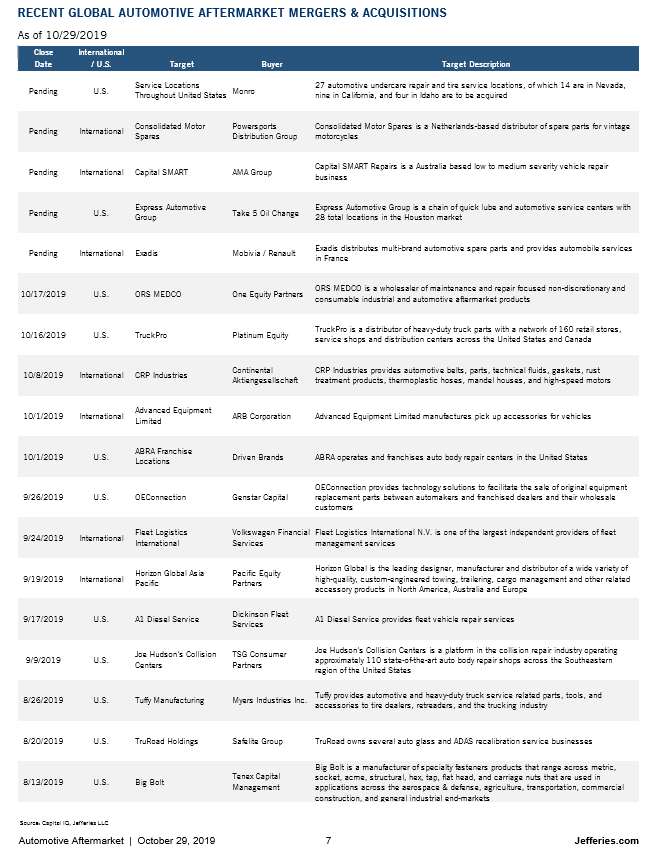
Image Courtesy of Jefferies Weekly Global Automotive Aftermarket Report
Industry Events
JD Power Auto Summit
February 14, 2020
WYNN, Las Vegas
3131 S Las Vegas Blvd
Las Vegas, NV 89109
877-321-9966
Automotive retail faces the continuous pressure of high-volume sales. With new business objectives and insights affecting the retail sales outlook for the foreseeable future, Auto Summit will consistently help navigate constant change. As the home of the Annual Franchise Assessment, the Summit provides exclusive insights into the auto industry with key market updates using J.D. Power data. More than 600 of auto’s biggest decision-makers and experts align to give our audience the perspective needed to be highly successful in the future state of automotive retail.

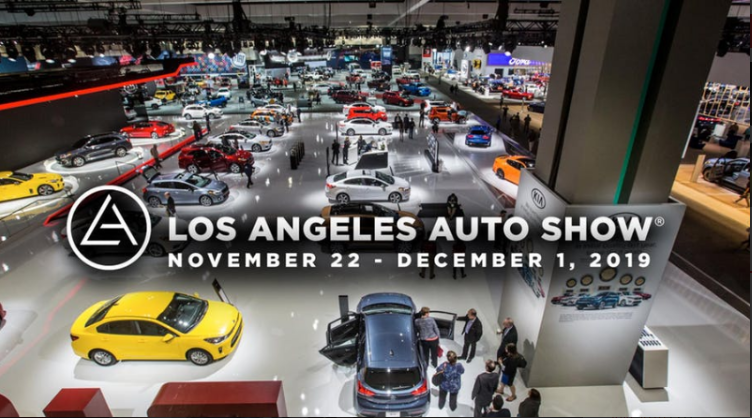
LA Auto Show
November 22 – December 1, 2019
LA Convention Center
Auto show season is in full swing, with the aftermarket wrapping up another successful SEMA show and consumers who are eager to stroll the upcoming LA Auto Show from November 22 to December 1.
This year’s event is sure to impress. With a 100+ year history, a record-breaking 65 new vehicles and 25 world debuts, the first-ever LEGO booth and plenty of family-friendly activities, there is something for everyone in attendance. Read more here.
Manufacturing ISM
Economic activity in the manufacturing sector contracted in October, and the overall economy grew for the 126th consecutive month, according to the nation’s supply executives in the latest Manufacturing ISM® Report On Business®. The October PMI® registered 48.3 percent, an increase of 0.5% from the September reading of 47.8 percent.
The Report On Business measures its data using the Purchasing Manager’s Index (PMI), which is an indicator of economic health in the manufacturing sector. A reading above 50 percent indicates that the manufacturing economy is generally expanding, while below 50 percent indicates that it is generally contracting.
“Comments from the panel reflect an improvement from the prior month, but sentiment remains more cautious than optimistic. October was the third consecutive month of PMI® contraction, at a slower rate compared to September. Inputs—expressed as supplier deliveries, inventories and imports—were again lower in October, due primarily to supplier delivery contraction offset by improvements in inventories. This resulted in a combined 0.4-percentage point net improvement in the Supplier Deliveries and Inventories indexes. Imports contraction quickened. Overall, inputs indicate (1) supply chains are meeting demand and (2) companies are more confident that materials received will be consumed in a reasonable time period. Prices decreased for the fifth consecutive month, at a faster rate,” said Timothy R. Fiore, CPSM, C.P.M., Chair of the Institute for Supply Management® (ISM®) Manufacturing Business Survey Committee.
According to the Bureau of Labor Statistics, U.S. import prices dropped 0.5 percent in October, after increasing 0.1 percent in September. The price index for U.S. exports decreased 0.1 percent in October following a 0.2-percent drop in September. Over the last year, import prices dropped 3.0 percent and export prices declined 2.2 percent.
“Global trade remains the most significant cross-industry issue. Food, Beverage & Tobacco Products remains the strongest industry sector and Transportation Equipment the weakest sector. Overall, sentiment this month remains cautious regarding near-term growth,” added Fiore.
Of the 18 manufacturing industries, five reported growth in October: Furniture & Related Products, Printing & Related Support Activitie, Food, Beverage & Tobacco Products, Wood Products and Computer & Electronic Products. The 12 industries reporting contraction in October include Primary Metals, Apparel, Leather & Allied Products, Textile Mills, Transportation Equipment, Plastics & Rubber Products, Machinery, Chemical Products, Petroleum & Coal Products, Electrical Equipment, Appliances & Components, Fabricated Metal Products, Miscellaneous Manufacturing and Paper Products.
- Commodities Up in Price: Natural Gas and Precious Metals
- Commodities Down in Price: Aluminum, Base Oil, Corrugated Boxes, High-Density Polyethylene, Nylon, Pulp, Scrap, Steel, Steel—Hot Rolled and Steel Products
- Commodities in Short Supply: Castings, Electronic Components and Helium
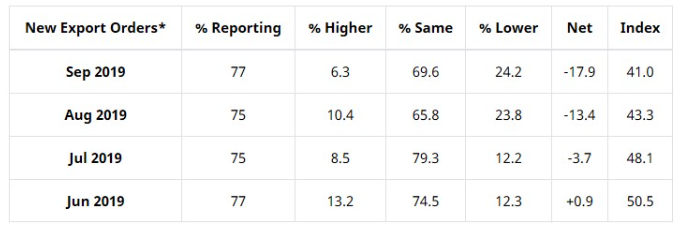
Exports
ISM’s New Export Orders Index registered 41% in September, 2.3 percentage points lower compared to the August reading of 43.3%, indicating that new export orders contracted for the third month in a row. “The index had its lowest reading since March 2009 (39.4%). One of the six big industry sectors expanded, and five contracted during the period. Many respondents continued to note global trade softness as a reason for sluggish activity,” said Fiore.
The two industries reporting growth in new export orders in September are Food, Beverage & Tobacco Products and Miscellaneous Manufacturing. The 11 industries reporting a decrease in new export orders include Apparel, Leather & Allied Products, Petroleum & Coal Products, Textile Mills, Fabricated Metal Products, Nonmetallic Mineral Products, Computer & Electronic Products, Transportation Equipment, Plastics & Rubber Products, Paper Products, Machinery and Chemical Products.
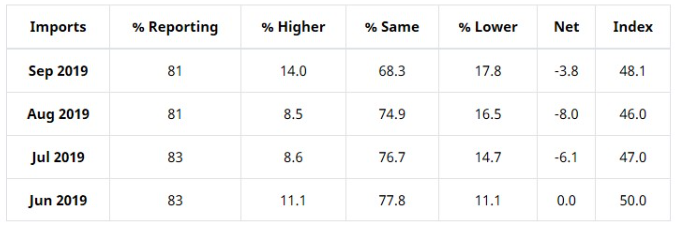
Imports
ISM’s Imports Index registered 48.1% during the same timeframe, an increase of 2.1 percentage points when compared to the 46 reported for August, indicating that imports contracted in September for the third consecutive month. “Five of the six big industry sectors contracted, with one expanding during the period. Imports Index contraction slowed during September,” explained Fiore.
The two industries reporting growth in imports during the month of September are Petroleum & Coal Products and Nonmetallic Mineral Products. The 11 industries reporting a decrease in imports include Apparel, Leather & Allied Products, Paper Products, Plastics & Rubber Products, Electrical Equipment, Appliances & Components, Fabricated Metal Products, Computer & Electronic Products, Miscellaneous Manufacturing; Machinery, Transportation Equipment, Chemical Products and Food, Beverage & Tobacco Products.