Key Performance Indicators Report – June 2019

*Note from the Editor:
Aftermarket shop owners have a lot going on: A lot on their minds, a lot on their plates, a lot of priorities in the shop and at home, and a lot of things-small and large-to worry about.
THE SHOP magazine was created as a tool to help shop owners manage their lot. Our primary quest has always been to help shop owners be better executives by keeping them informed of modern business tactics and industry trends.
Our staff also understands the old saying, time is money, veers closer to gospel than trope. That’s why we’re launching a new monthly article dedicated to providing key performance indicators (KPI) that drive the automotive aftermarket and beyond. Having this valuable economic data summarized in one place, we hope, saves our readers a lot of time.
Scroll below for the following KPI datapoints: state of the economy, vehicle sales, new-car prices, diesel vehicle sales, Manheim Used Vehicle Index, fleet sales, professional market data, vehicle recalls, auto finance, auto lease activity, RV shipments, consumer confidence, NFIB Small Business Index, retail & wholesale inventories, housing starts, construction spending, manufacturing ISM, and imports & exports.
State of the Economy
Real gross domestic product (GDP) increased 2.2 percent in the fourth quarter of 2018. Additionally, real GDP increased at an annual rate of 3.2 percent during the first quarter of 2019, as a result of positive contributions from personal consumption expenditures (PCE), private inventory investment, exports, state and local government spending, as well as non-residential fixed investment, according to the U.S. Bureau of Economic Analysis.
Recent U.S. Bureau of Labor Department statistics report a similar uptick, with April unemployment rates lower than a year earlier in 306 of the 389 metropolitan areas, higher in 57 areas and unchanged in 26 areas. Furthermore, a total of 149 areas had jobless rates of less than 3 percent and two areas had rates of at least 10 percent. During this timeframe, Ames, Iowa, showed the lowest unemployment rate at 1.3 percent. Burlington-South Burlington, Vermont, and Iowa City, Iowa, followed at 1.5 percent and Midland, Texas, 1.7 percent. El Centro, California, and Yuma, Arizona, had the highest unemployment rates, 16.2 percent and 14.3 percent respectively.
Among the major worker groups, the unemployment rates for adult men (3.3 percent), adult women (3.2 percent), teenagers (12.7 percent), Blacks (6.2 percent), Hispanics (4.2 percent), Whites (3.3 percent), and Asians (2.5 percent) showed little or no change in May, according to the Bureau of Labor Statistics.
Furthermore, monthly job gains have averaged 164,000 in 2019, compared with an average gain of 223,000 per month in 2018, according to Labor Department statistics.
In May, employment continued to trend up in professional and business services and in health care. Construction employment changed little in May (+4,000), following an increase of 30,000 in April. The construction industry has added 215,000 jobs in the past 12 months.
Other major industries that showed insignificant change during May include mining, manufacturing, wholesale trade, retail trade, transportation and warehousing, information, financial activities, leisure and hospitality, and government.
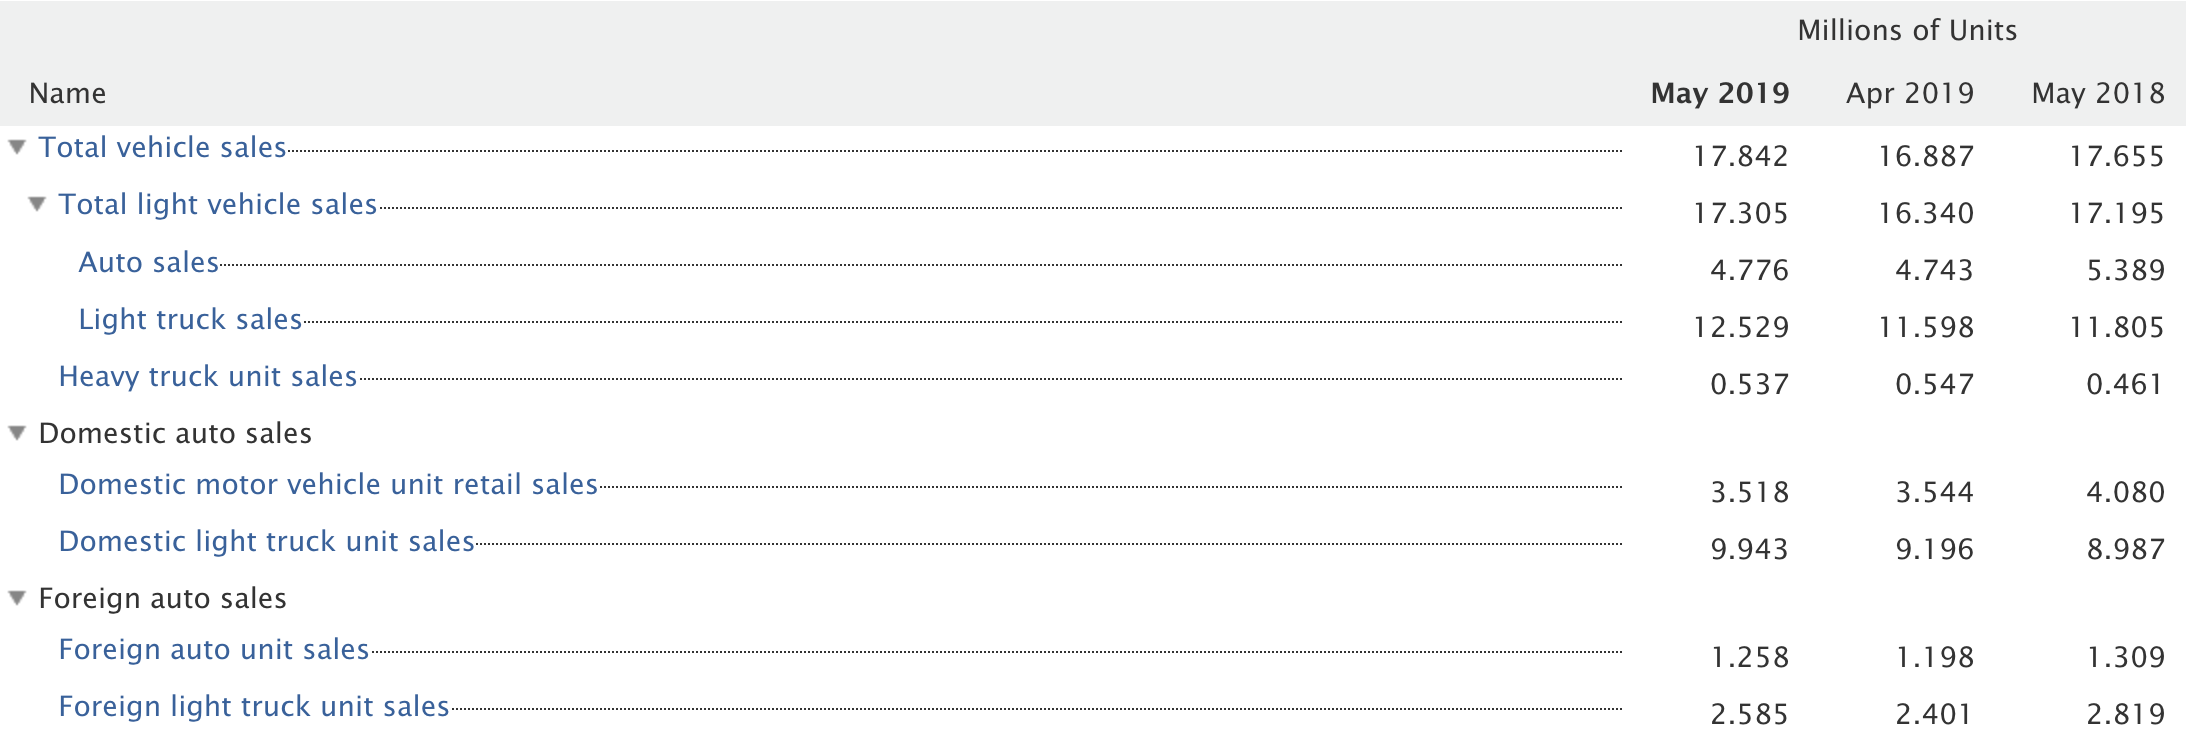
Vehicle Sales
During May, total vehicle sales showed an insignificant change year-over-year; however, there was a healthy increase from the month prior, with light vehicle sales-primarily light truck units-driving the vast majority of total units sold.
Domestic motor vehicle unit retail sales are relatively flat in comparison to April but demonstrated a promising year-over-year increase. Similarly, domestic light truck unit sales continue to trend upward.
The May SAAR came in at 17.3 million, up slightly from last year’s 17.2 million and a big increase from April’s 16.3, according to Cox Automotive.
Reference the chart below for additional details.
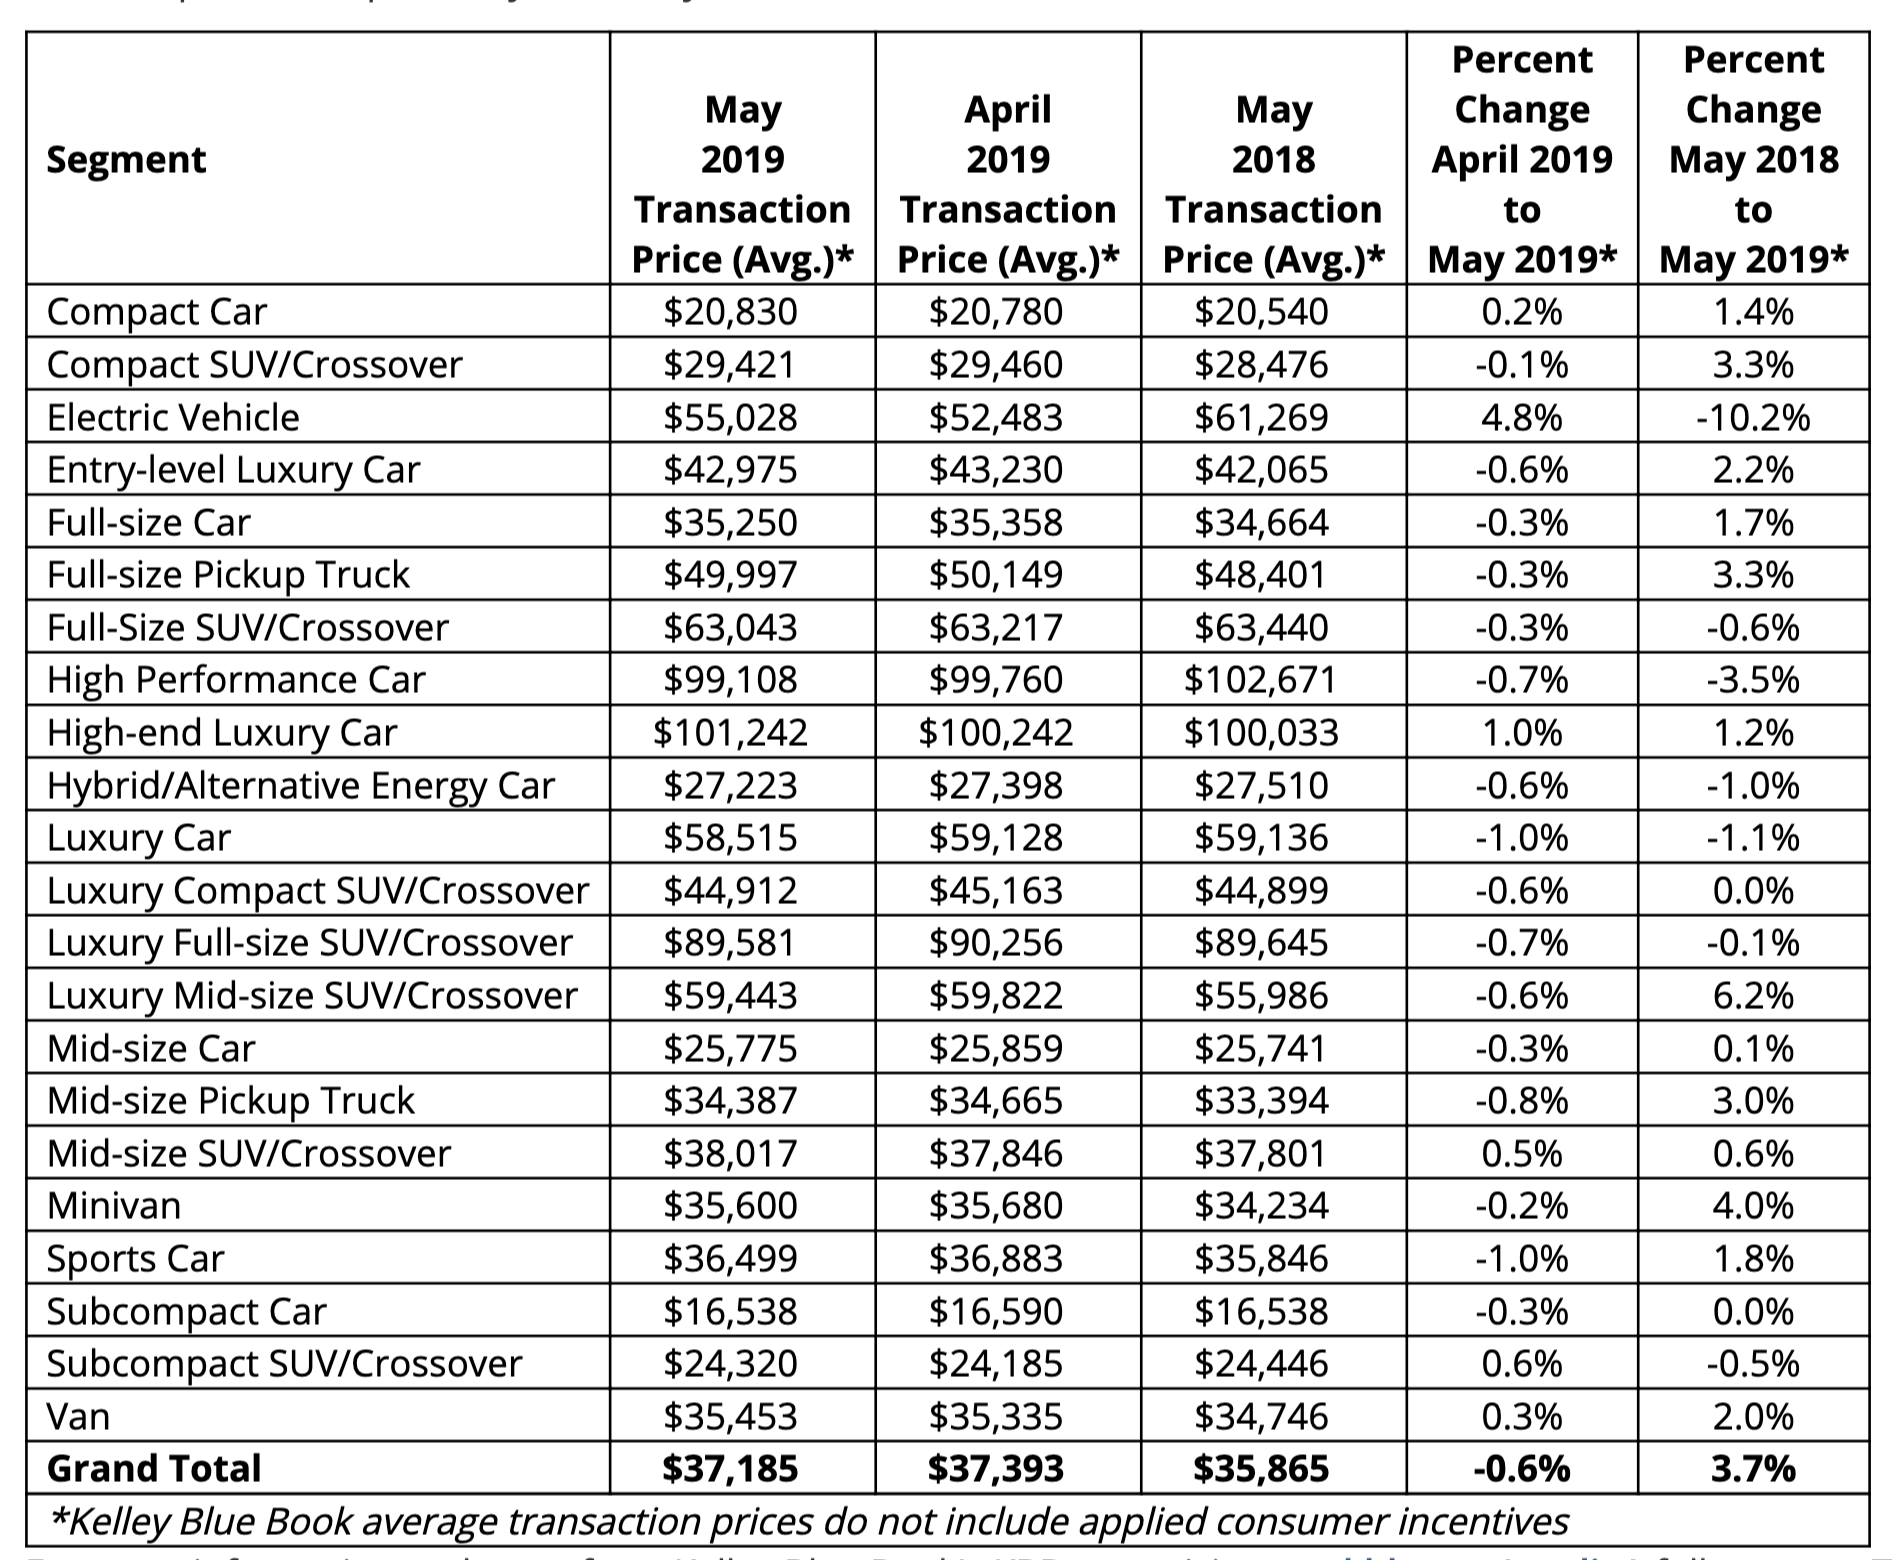
New-Car Prices
Kelley Blue Book estimated a 4-percent year-over-year increase for new-car prices in May, while the average light vehicle transaction price in the U.S. was $37,185. New vehicle prices increased $1,320 on average, up 3.7 percent from May of last year, while decreasing 0.6 percent since last month.
“Although May’s sales tally is expected to be down, the good news is that average prices for those sales rose nearly 4 percent from one year ago,” said Tim Fleming, Kelley Blue Book analyst. “SUVs bounced back in May 2019 and drove many of those increases for automakers, especially those with new and redesigned models on dealer lots. However, with this expected to be the fifth down month in a row, the question for this year remains whether automakers will start to trade some of their pricing power for greater incentives and more sales.”
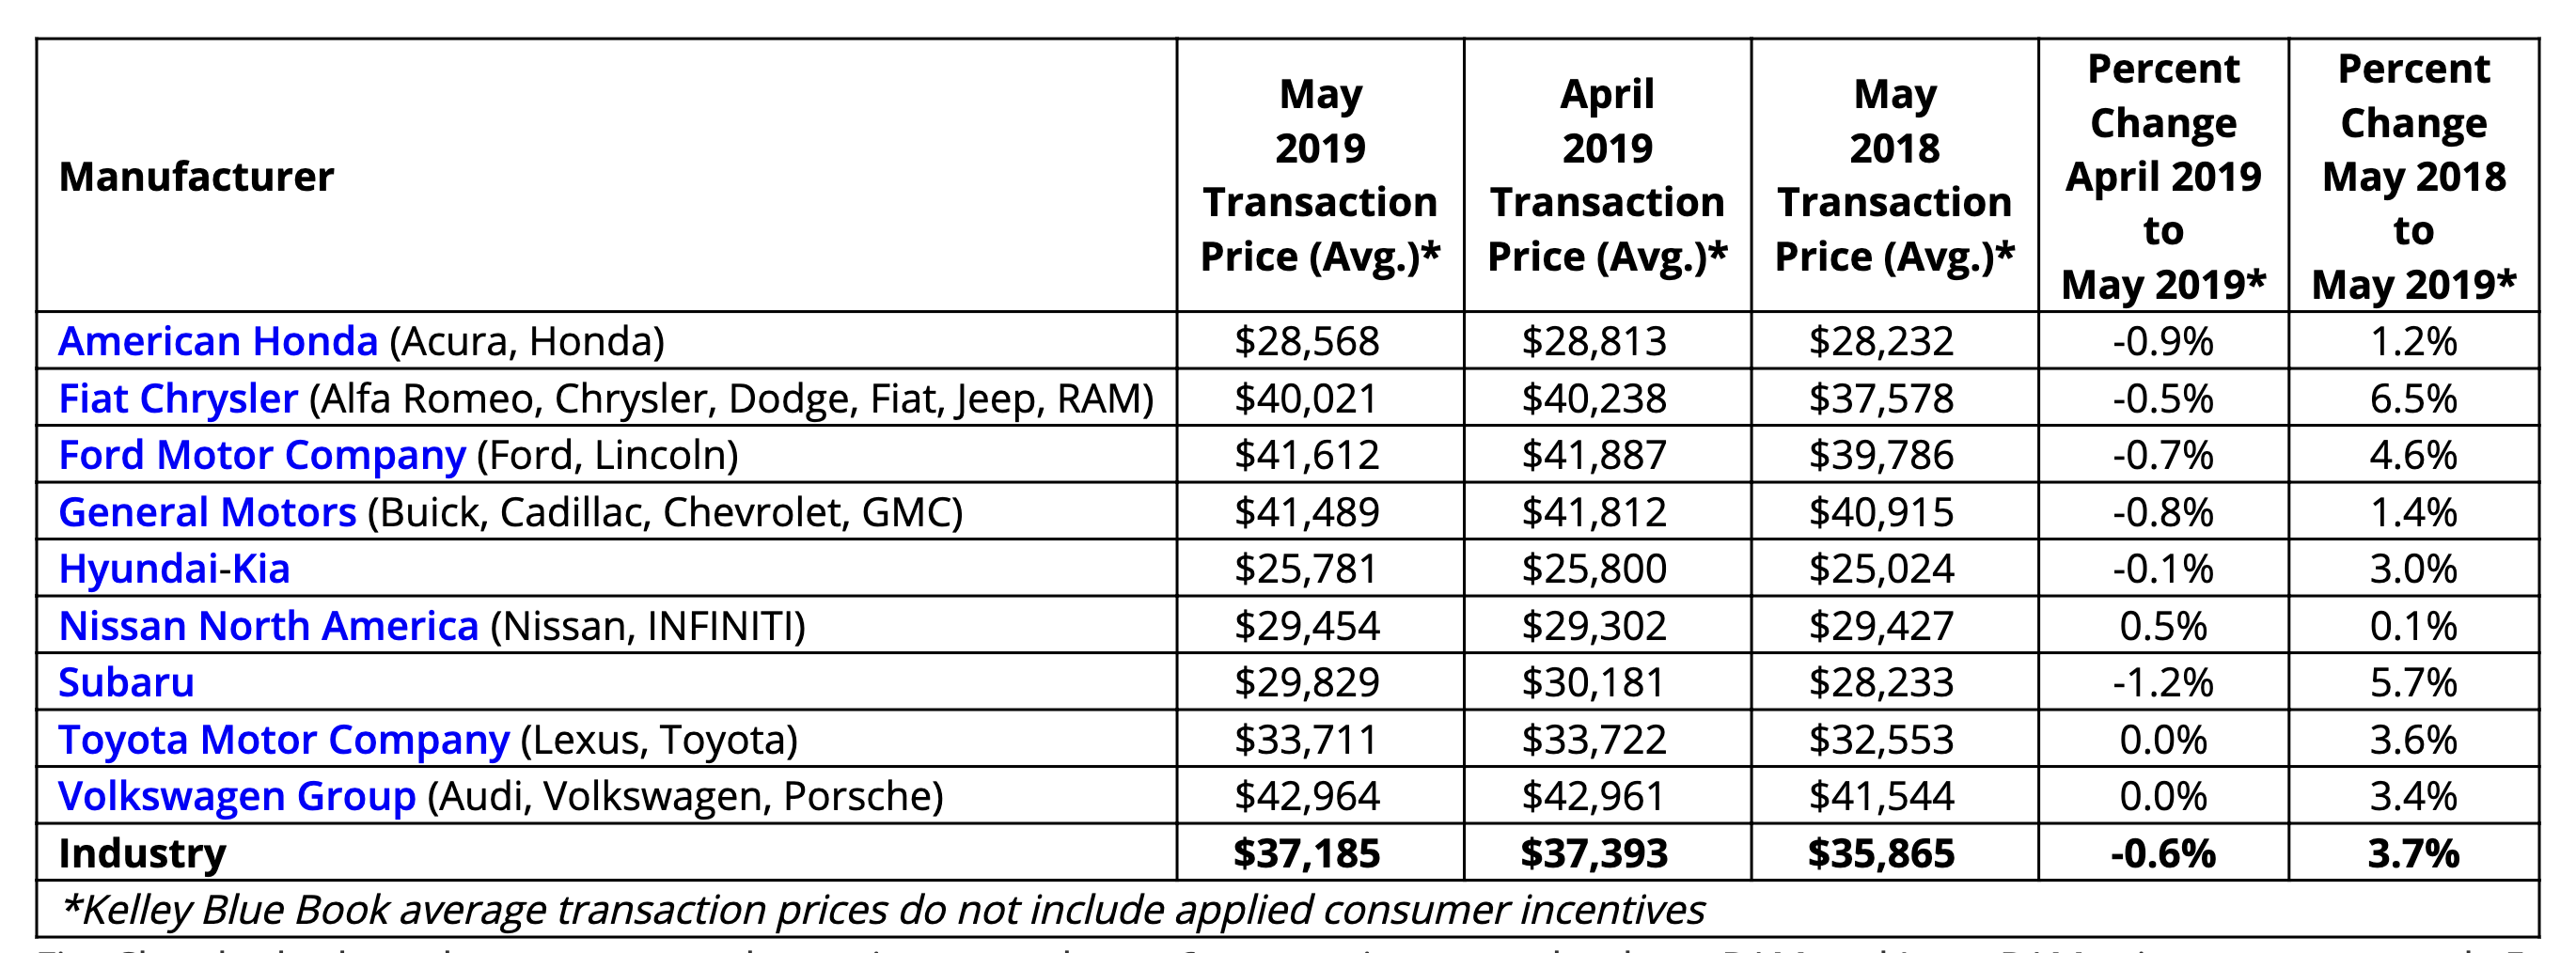
As it applies to brand power, Fiat Chrysler experienced another strong month. The company reported more than a 6-percent increase, which can be attributed primarily to Ram and Jeep sales. Consumers continue to invest in popular models like the 1500 and new 2500.
Meanwhile, Jeep Wrangler pulled off a 7-percent increase of its own, while the all-new Gladiator enjoyed a successful launch driven by the pricey Rubicon trim level, which retails more than $50,000.
On the import side, average transaction prices for Subaru rose by 5 percent, with the new Ascent SUV and redesigned Forester proving to be a valuable boost in sales.
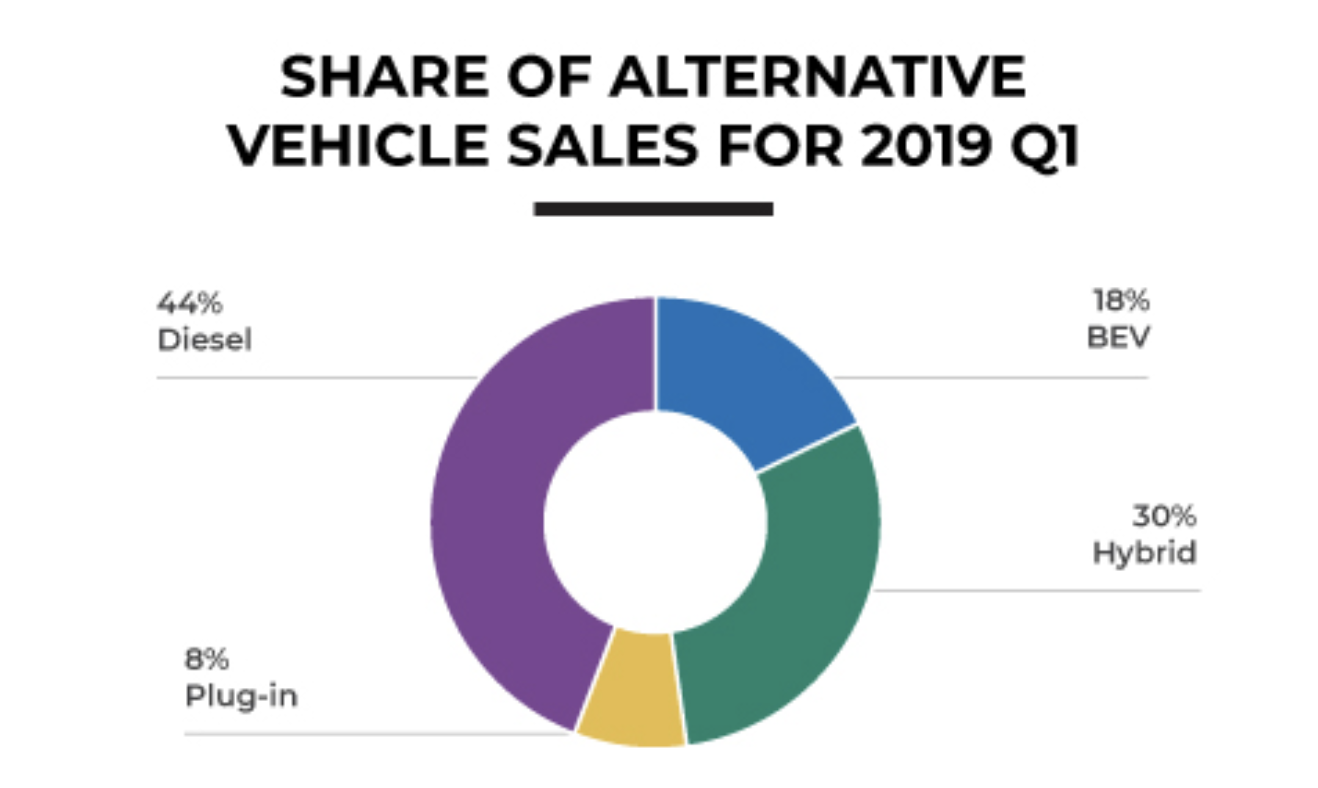
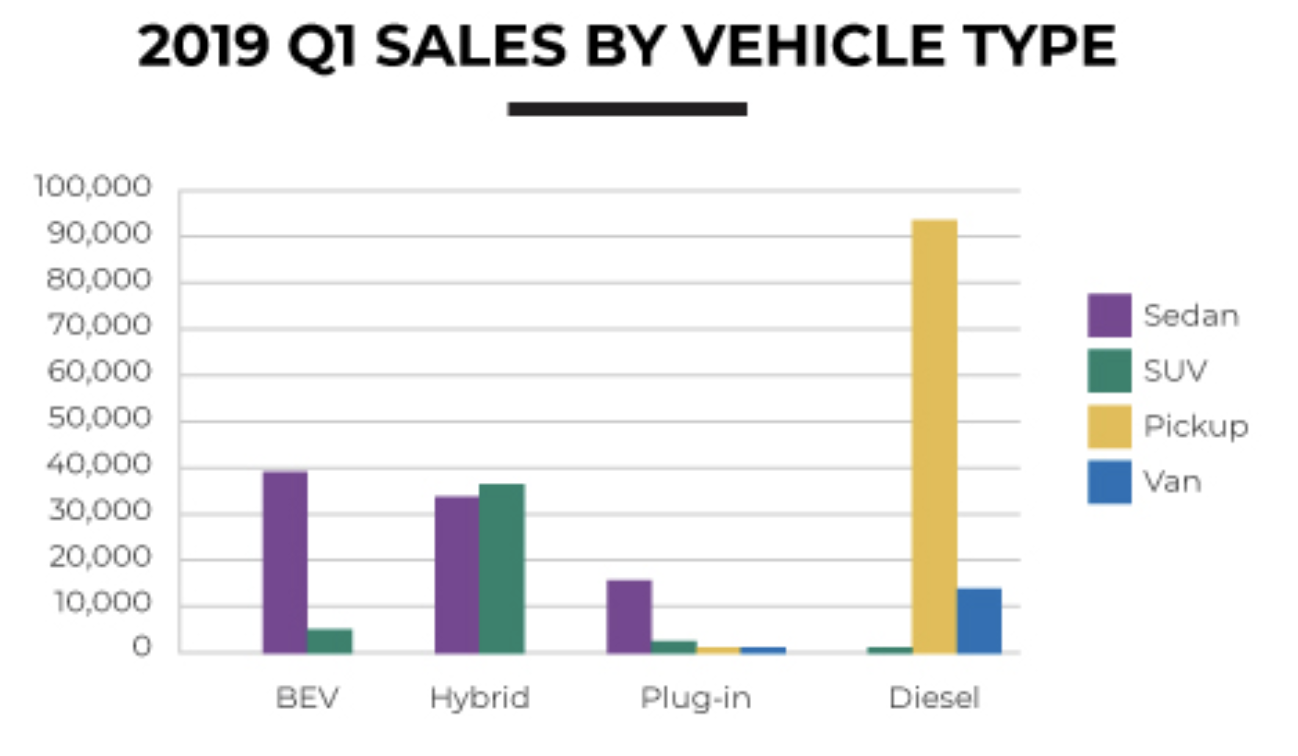
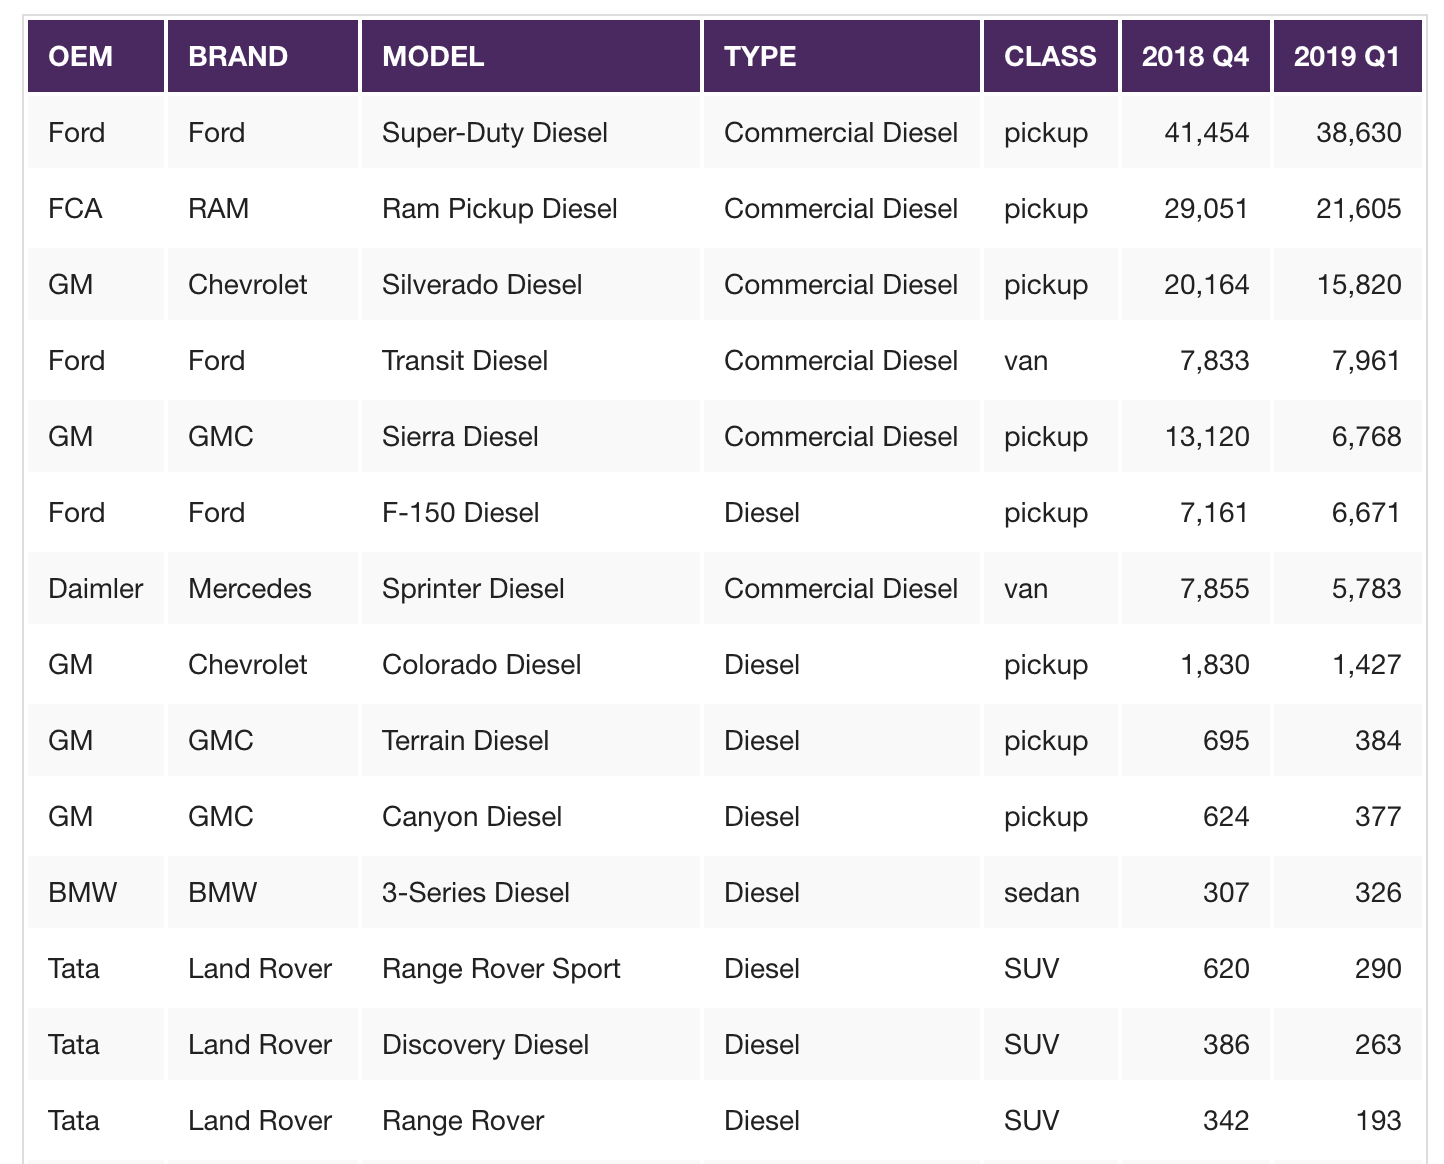
Diesel Vehicle Sales
The Diesel Technology Forum shared the following charts and table to demonstrate the first quarter performance of the diesel vehicle market.
Manheim Used Vehicle Index
The Manheim Index registered 139.6 in May, a 4-percent increase from the same month a year ago.
The Manheim Index is the result of Manheim applying statistical analysis to its database of more than 5 million annual used-vehicle transactions. The subsequent measurement of used-vehicle prices is independent of underlying shifts in the characteristics of vehicles being sold, according to the company.
“Wholesale used vehicle prices increased 0.85 percent month-over-month in May,” according to Manheim. But Cox Automotive reports that used vehicle sales volume was down 4-percent year-over-year in May. Cox also estimates the May used-vehicle SAAR to be 39.2 million, down from 39.7 million last May, and slightly down from April’s 39.3 million rate.
On a year-over-year basis, most major market segments demonstrated seasonally adjusted price gains in May. Midsize cars and pickups outperformed the overall market.
Fleet Sales
Fleets are helping drive new-car sales, according to the Cox Automotive’s weekly fleet summary.
“New-vehicle sales were stronger in May than they had been so far this year, though still off from a year ago. The improvement was again mainly driven by gains in fleet sales; retail sales were down, though incentives grew.”
Combined rental, commercial, and government purchases of new vehicles were up 11-percent year-over-year in May, and up 29-percent month-over-month, according to Manheim. Commercial (+12 percent) and rental (+14 percent) fleet channels were up year-over-year in May.
Click to review THE SHOP magazine’s detailed coverage of the current state of the commercial work truck and van industry.
Vehicle Recalls
Ford Motor Co. has issued a safety recall on 1.2 million 2011-’17 Ford Explorer vehicles. The Explorer’s rear suspension toe link may fracture under stressed conditions. A fracture of a rear toe link significantly diminishes steering control, increasing the risk of a crash.
One customer reported hitting a curb when the toe link broke; however, Ford is not aware of any reports of injury related to this condition.
Dealers will remove and replace left and right-hand rear suspension toe links with a new forged toe link and align the rear suspension. The Ford reference number for this recall is 19S17.
Meanwhile, Ford issued another safety recall on 123,000 2013 Ford F-150 trucks equipped with 5.0-liter and 6.2-liter gasoline engines that had the powertrain control module software reprogrammed as part of recall 19S07.
The powertrain control module software used to service these vehicles in accordance with recall 19S07 was incomplete. It did not have the updates necessary to prevent a potential unintended downshift into first gear or the updates necessary to ensure illumination of the malfunction indicator light in the event of an intermittent transmission output speed sensor signal, according to Ford.
A vehicle without the intended 19S07 calibration remains at risk for unintended transmission downshift due to intermittent output speed sensor failure. Depending on vehicle speed, an abrupt transmission downshift to first gear without warning could result in loss of vehicle control, increasing the risk of a crash. Ford is not aware of any reports of accident or injury related to this issue.
Dealers will reprogram the powertrain control module with the appropriate software calibration. The Ford reference number for this recall is 19S19.
Ford is not the only Detroit automaker facing recalls this month, as both FCA and GM have some issues to work out as well, according to The Engine Block, an enthusiast blog powered by Keystone Automotive Operations.
FCA is recalling nearly 300,000 RAM 1500 pickups for potential airbag and seatbelt failure due to a software glitch. GM is facing a slightly trickier issue as it attempts to sort out why seven of its diesel truck models are experiencing short circuits with their engine block heaters, resulting in potential fires. Nineteen such fires have been reported with no injuries
GM has yet to determine a fix for the roughly 350,000 vehicles affected, according to The Engine Block.
RV Market
Motorhome and towable travel trailer sales continued to slide in May, as they have in each month this year. Overall RV shipments are down 22.1 percent for the year, according to data provided by the RV Industry Association (RVIA).
May’s RV shipment tallies compared to May 2018:
- 31,807 shipped travel trailers, down 17.2 percent
- 8,059 shipped fifth wheel trailers, down 6.9 percent
- 5,356 shipped motorhomes, down 8.8 percent
RVIA expects RV shipments to gain in the second half of the year, due to renewed growth in wages, employment, as well as low inflation and interest rates.
RV shipments are projected to total 416,300 units in 2019, down 13.9 percent from the 2018 year-end total of 483,700 units, before gaining 2.4 percent to 426,700 units in 2020, according a RV RoadSigns Special 2020 Industry Forecast from Dr. Richard Curtin, director of the survey of consumers at the University of Michigan. Those annual totals would rank as the fourth and fifth highest in the last 40 years, trailing only the totals from the previous three-year period that saw the RV industry reach an all-time high, according to RVIA.
Shipments of conventional travel trailers are expected to account for the largest share of the anticipated gains, while shipments of all types of motorhomes are expected to be largely unchanged in 2020 from 2018. Towable RVs are projected to reach 365,200 units in 2019 and 375,700 units in 2020. Motorhomes are forecasted at 51,100 units in 2019 and 51,000 in 2020.
The RV industry’s overall economic impact to the U.S. economy is worth $114 billion, according to RVIA’s RVs Move America Economic Impact Study. The industry supports nearly 600,000 jobs, contributing more than $32 billion in wages, as well as paying more than $12 billion in federal, state and local taxes.
The $114 billion total annual RV industry economic impact includes:
- $68 billion generated by RV manufacturers and suppliers
- $25.6 billion by RV campgrounds and related travel
- $20.1 billion by RV sales and service activities
“RVs are the heart of an industry that has become an American juggernaut, a business that has tripled in size since the Great Recession of 2009,” said Garry Enyart, RVIA chairman.
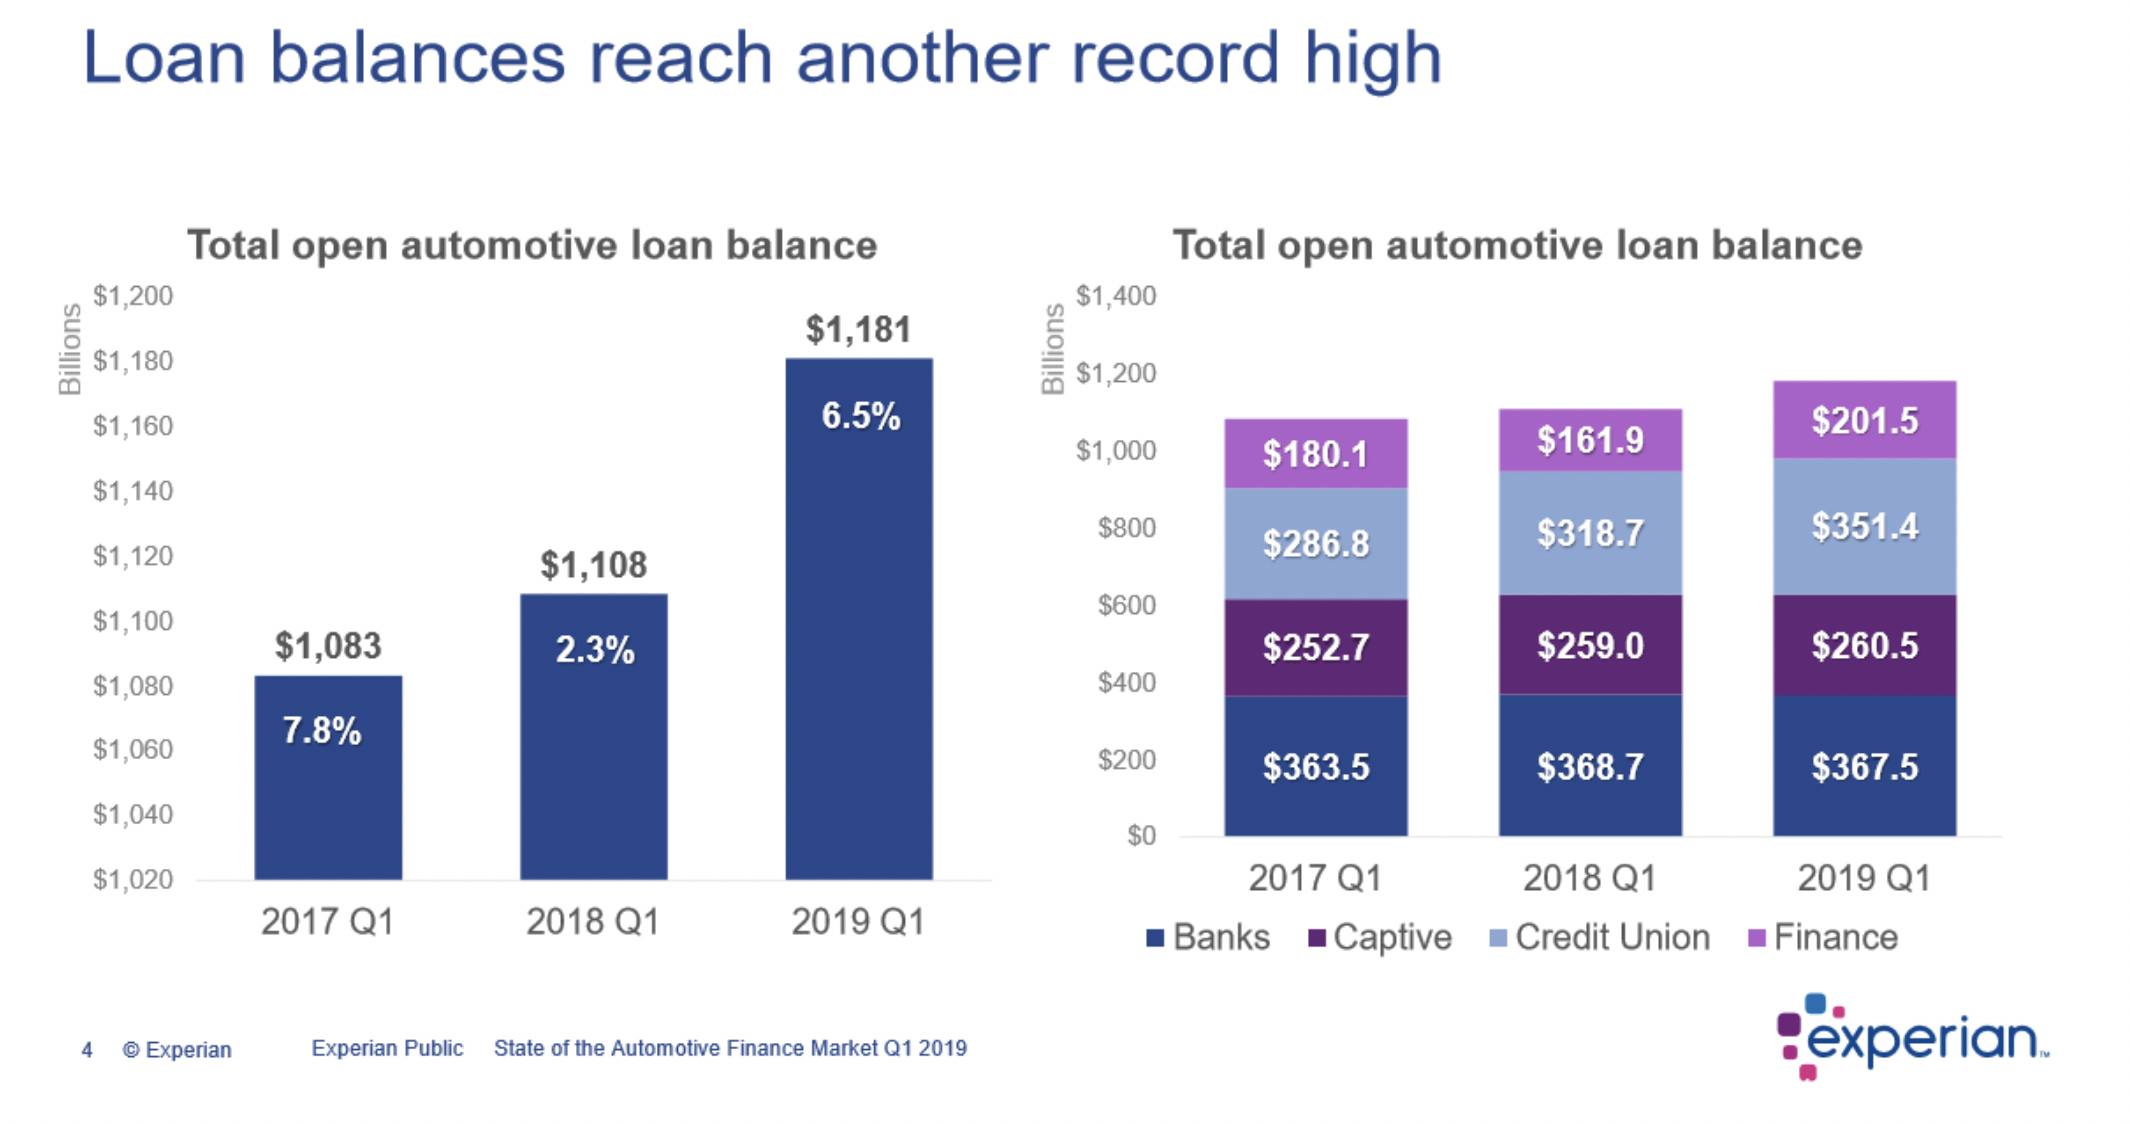
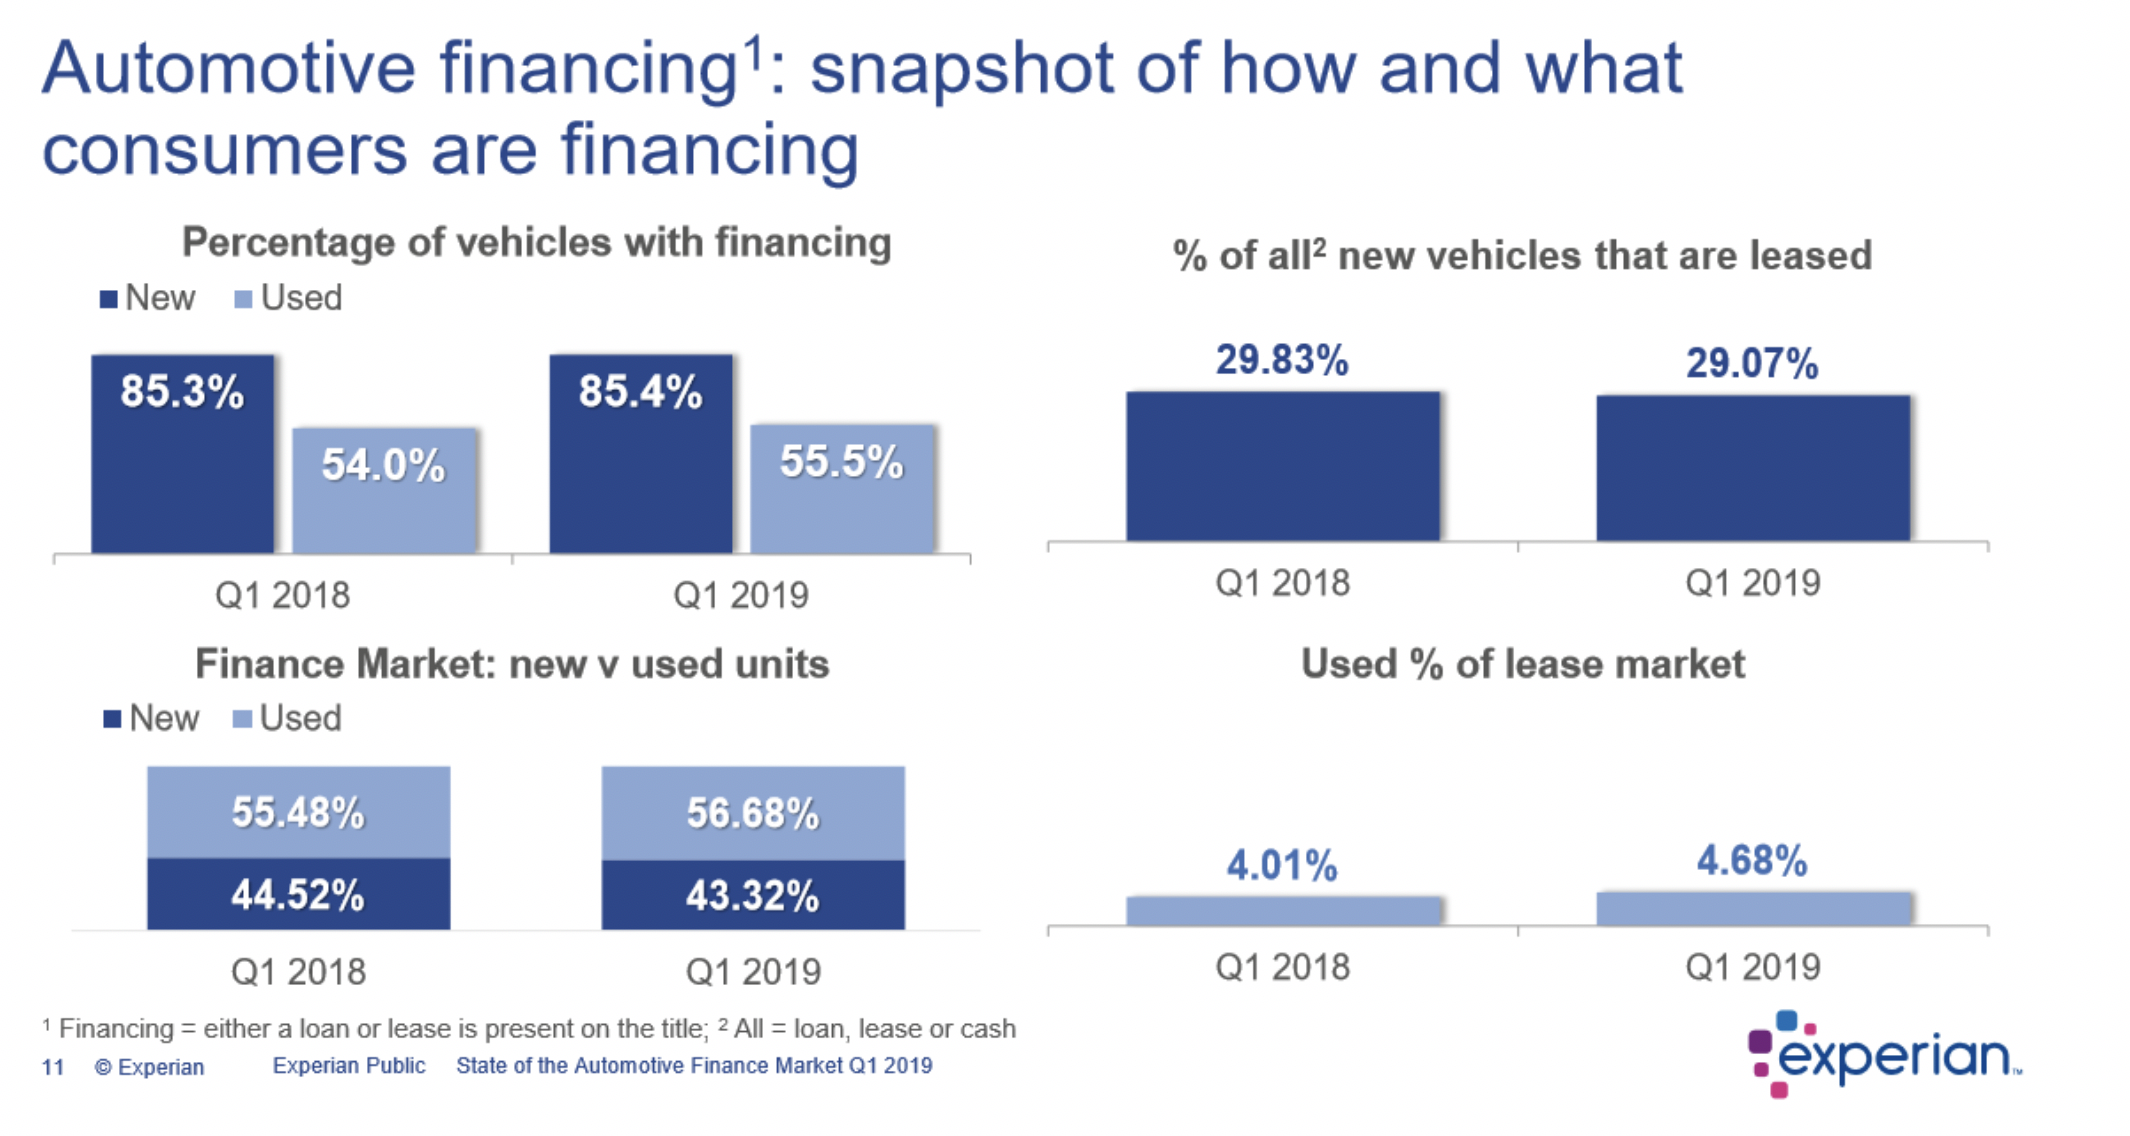
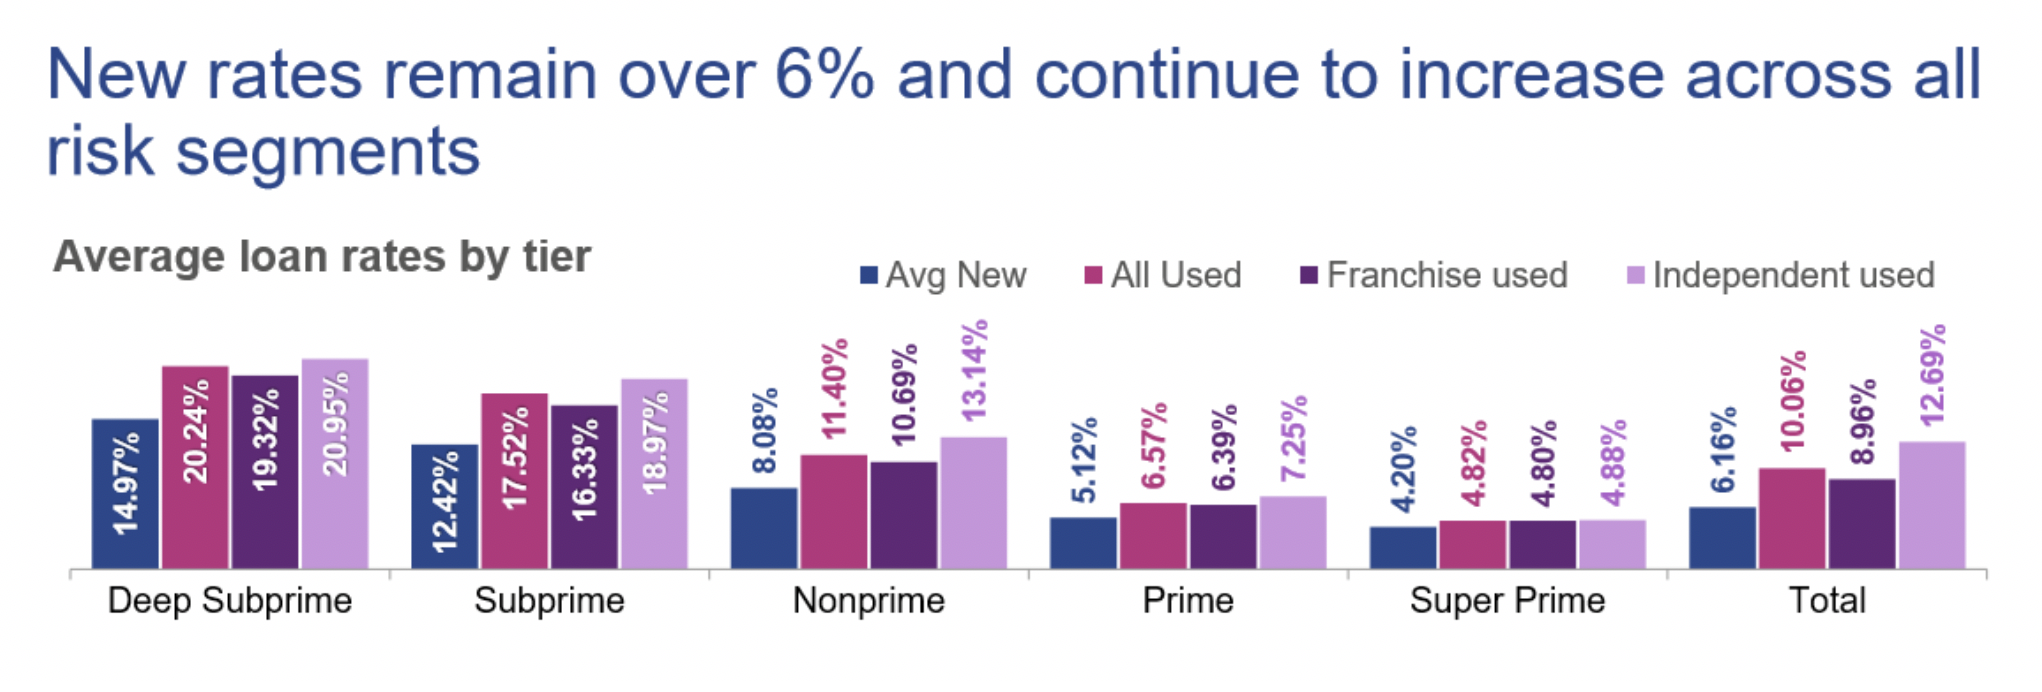
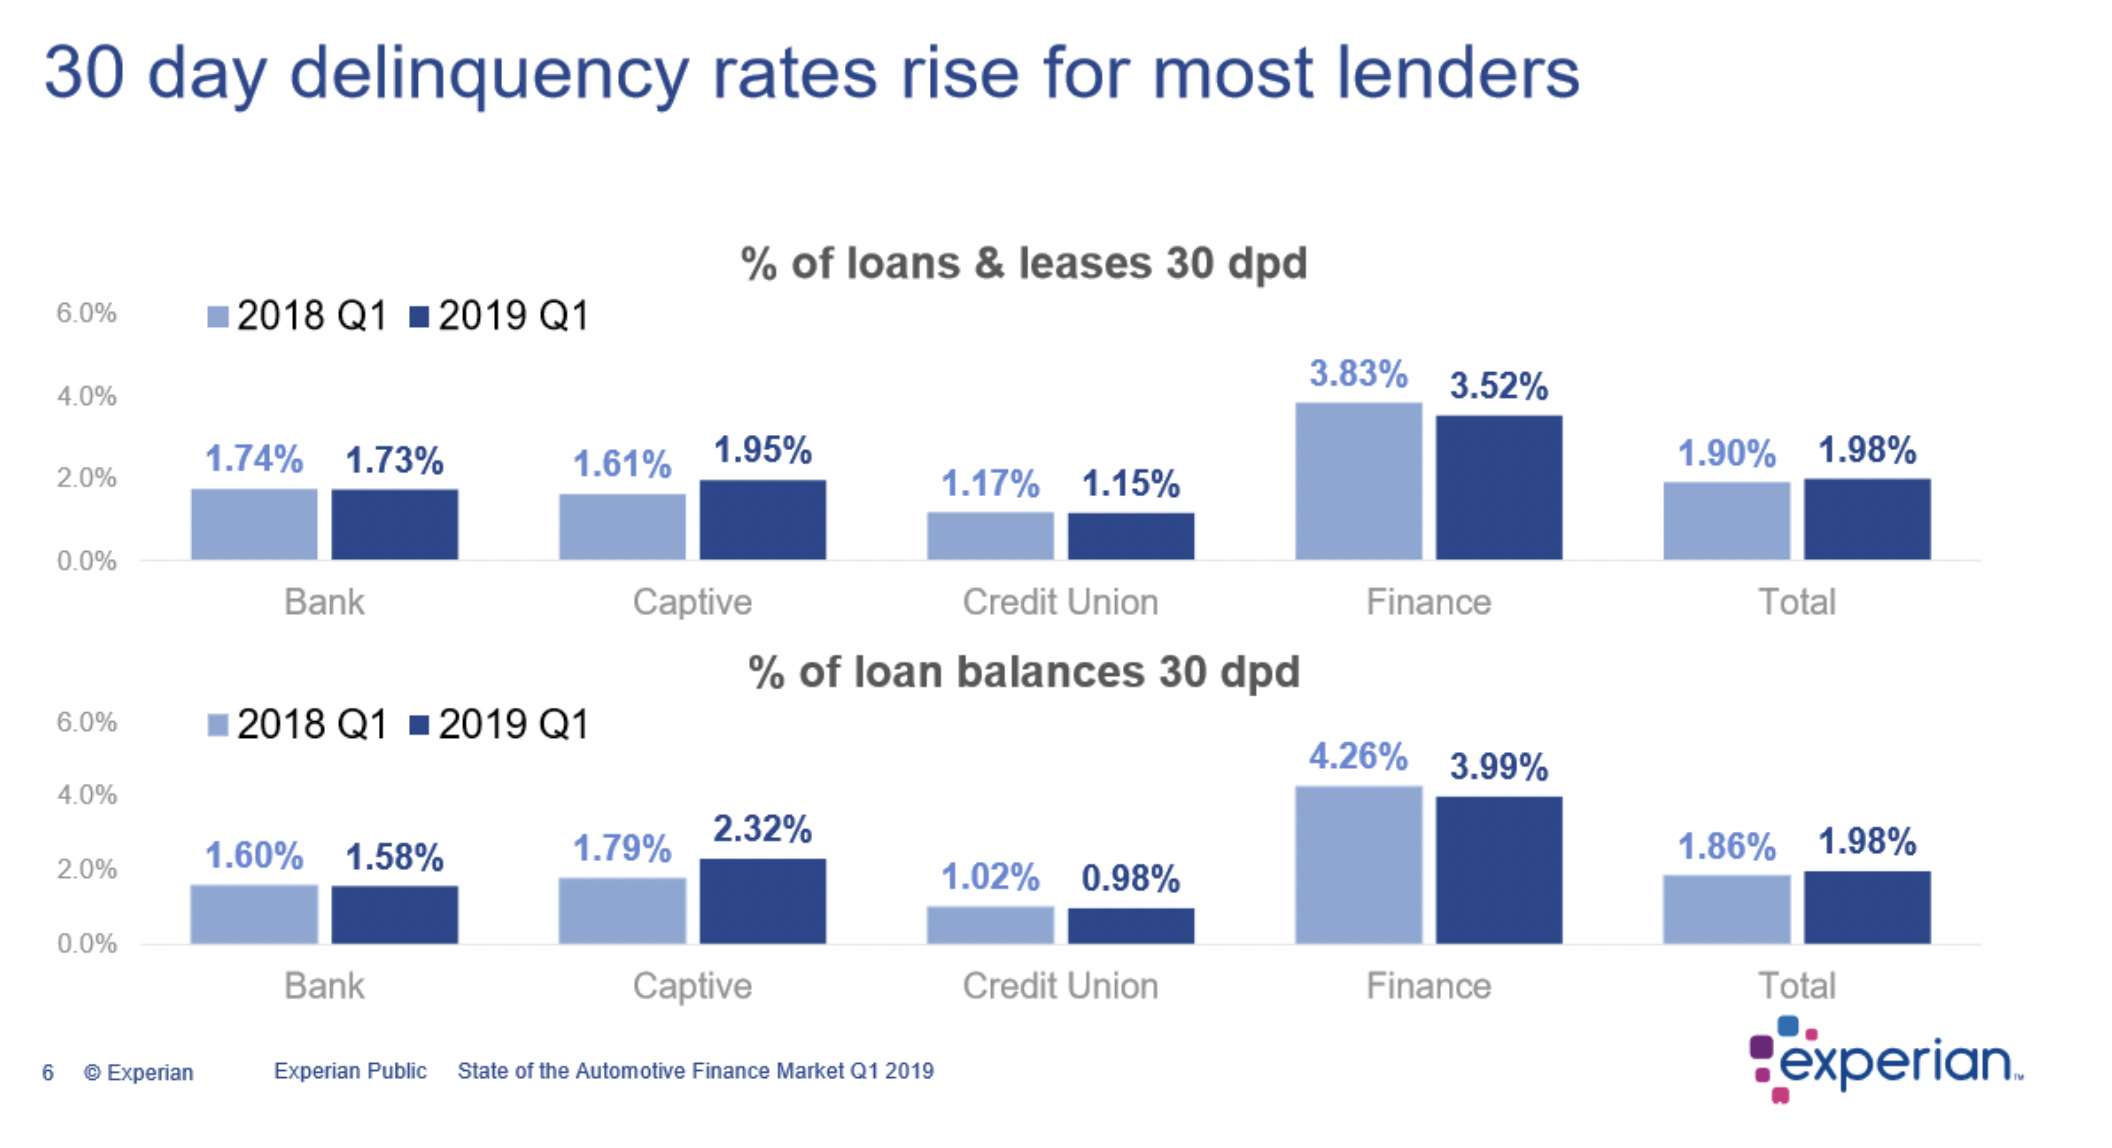
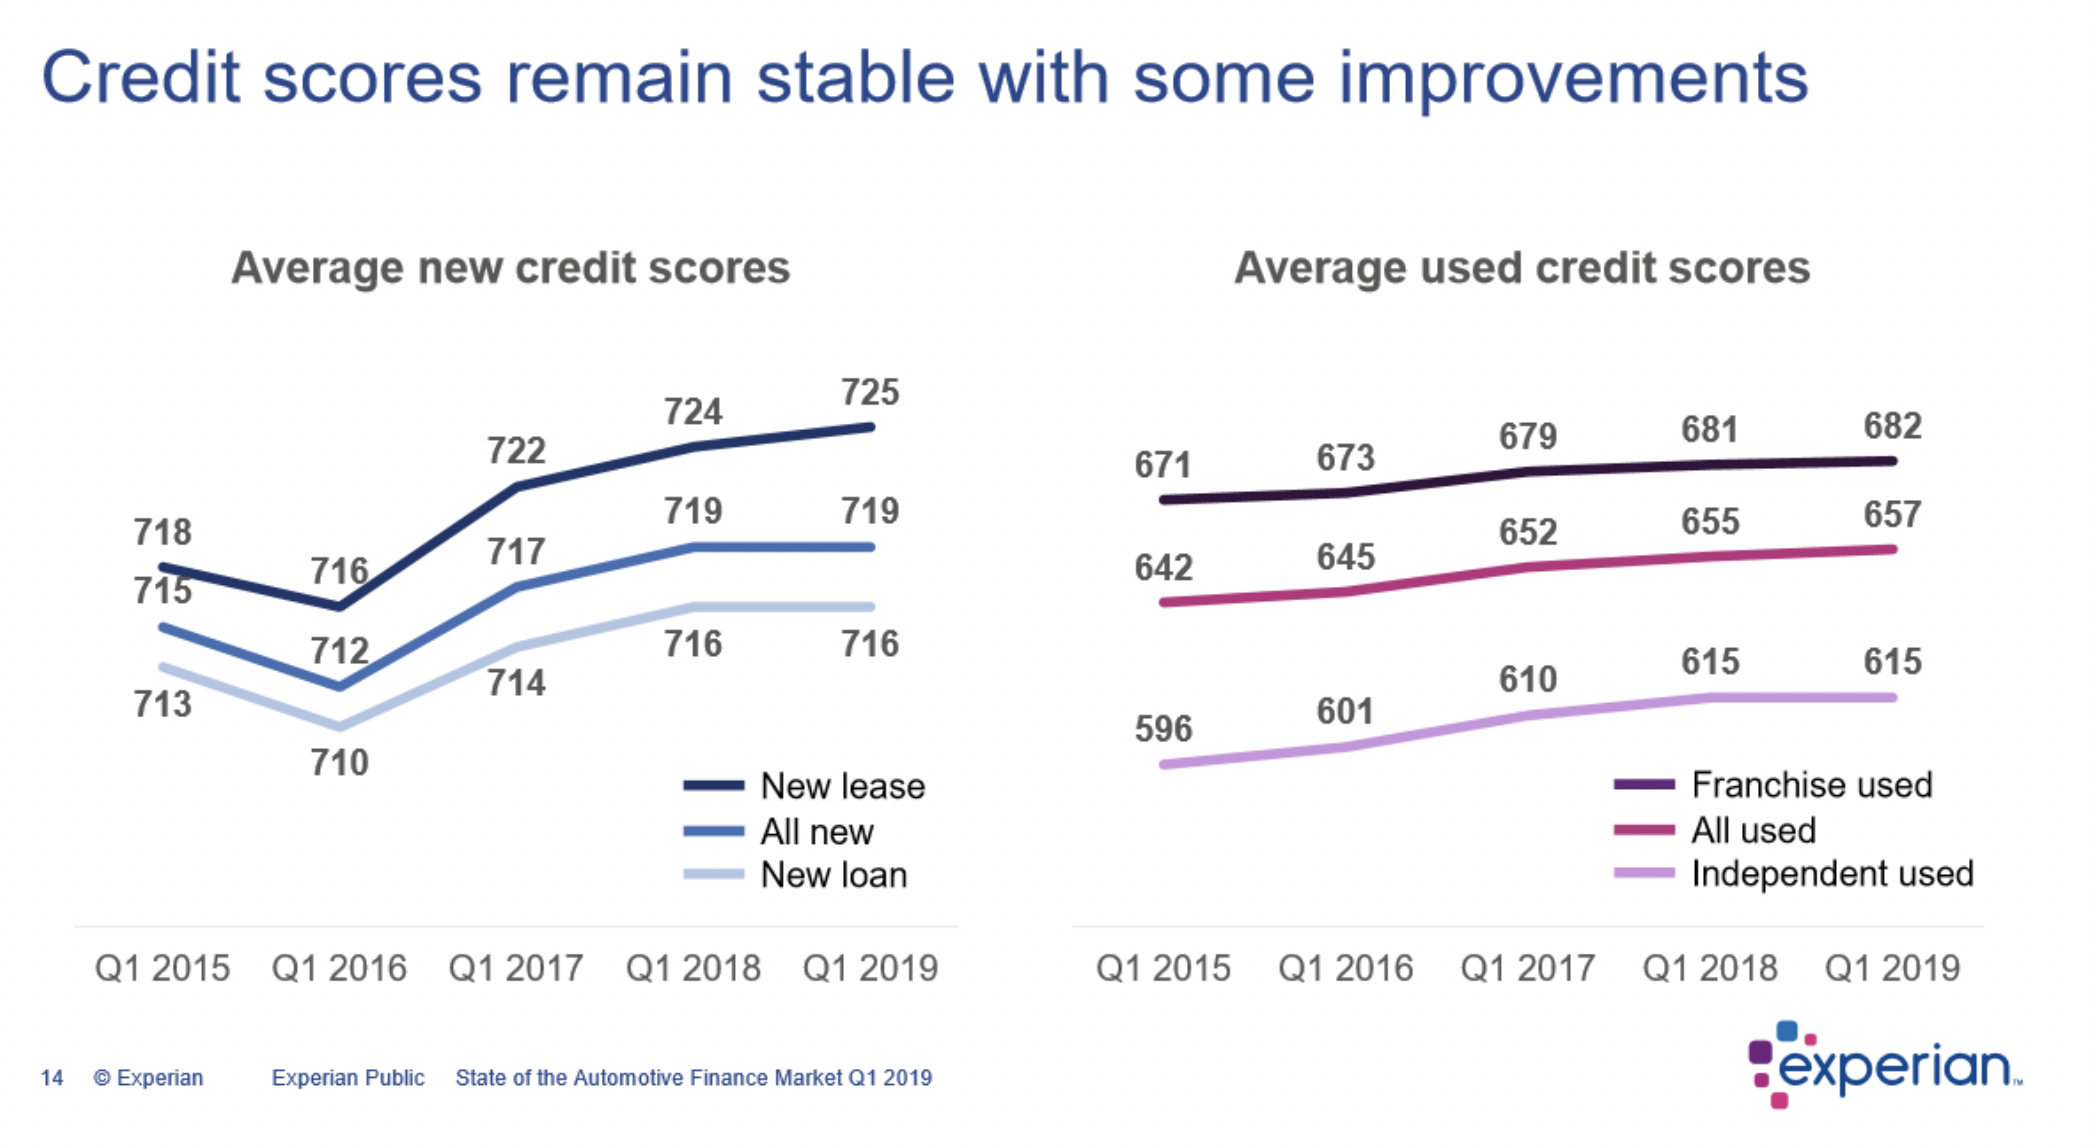
Automotive Finance Health
While overall vehicle sales remain healthy, the automotive finance industry is experiencing some record high numbers, including loan balances in excess of $1.18 trillion, according to Experian. Furthermore, 30-day delinquencies increased year-over-year and average new-loan amounts have surpassed $32,000, driving payments over $550. Used loan payments also reach their own record highs at more than $400.
Review the charts below for more details.
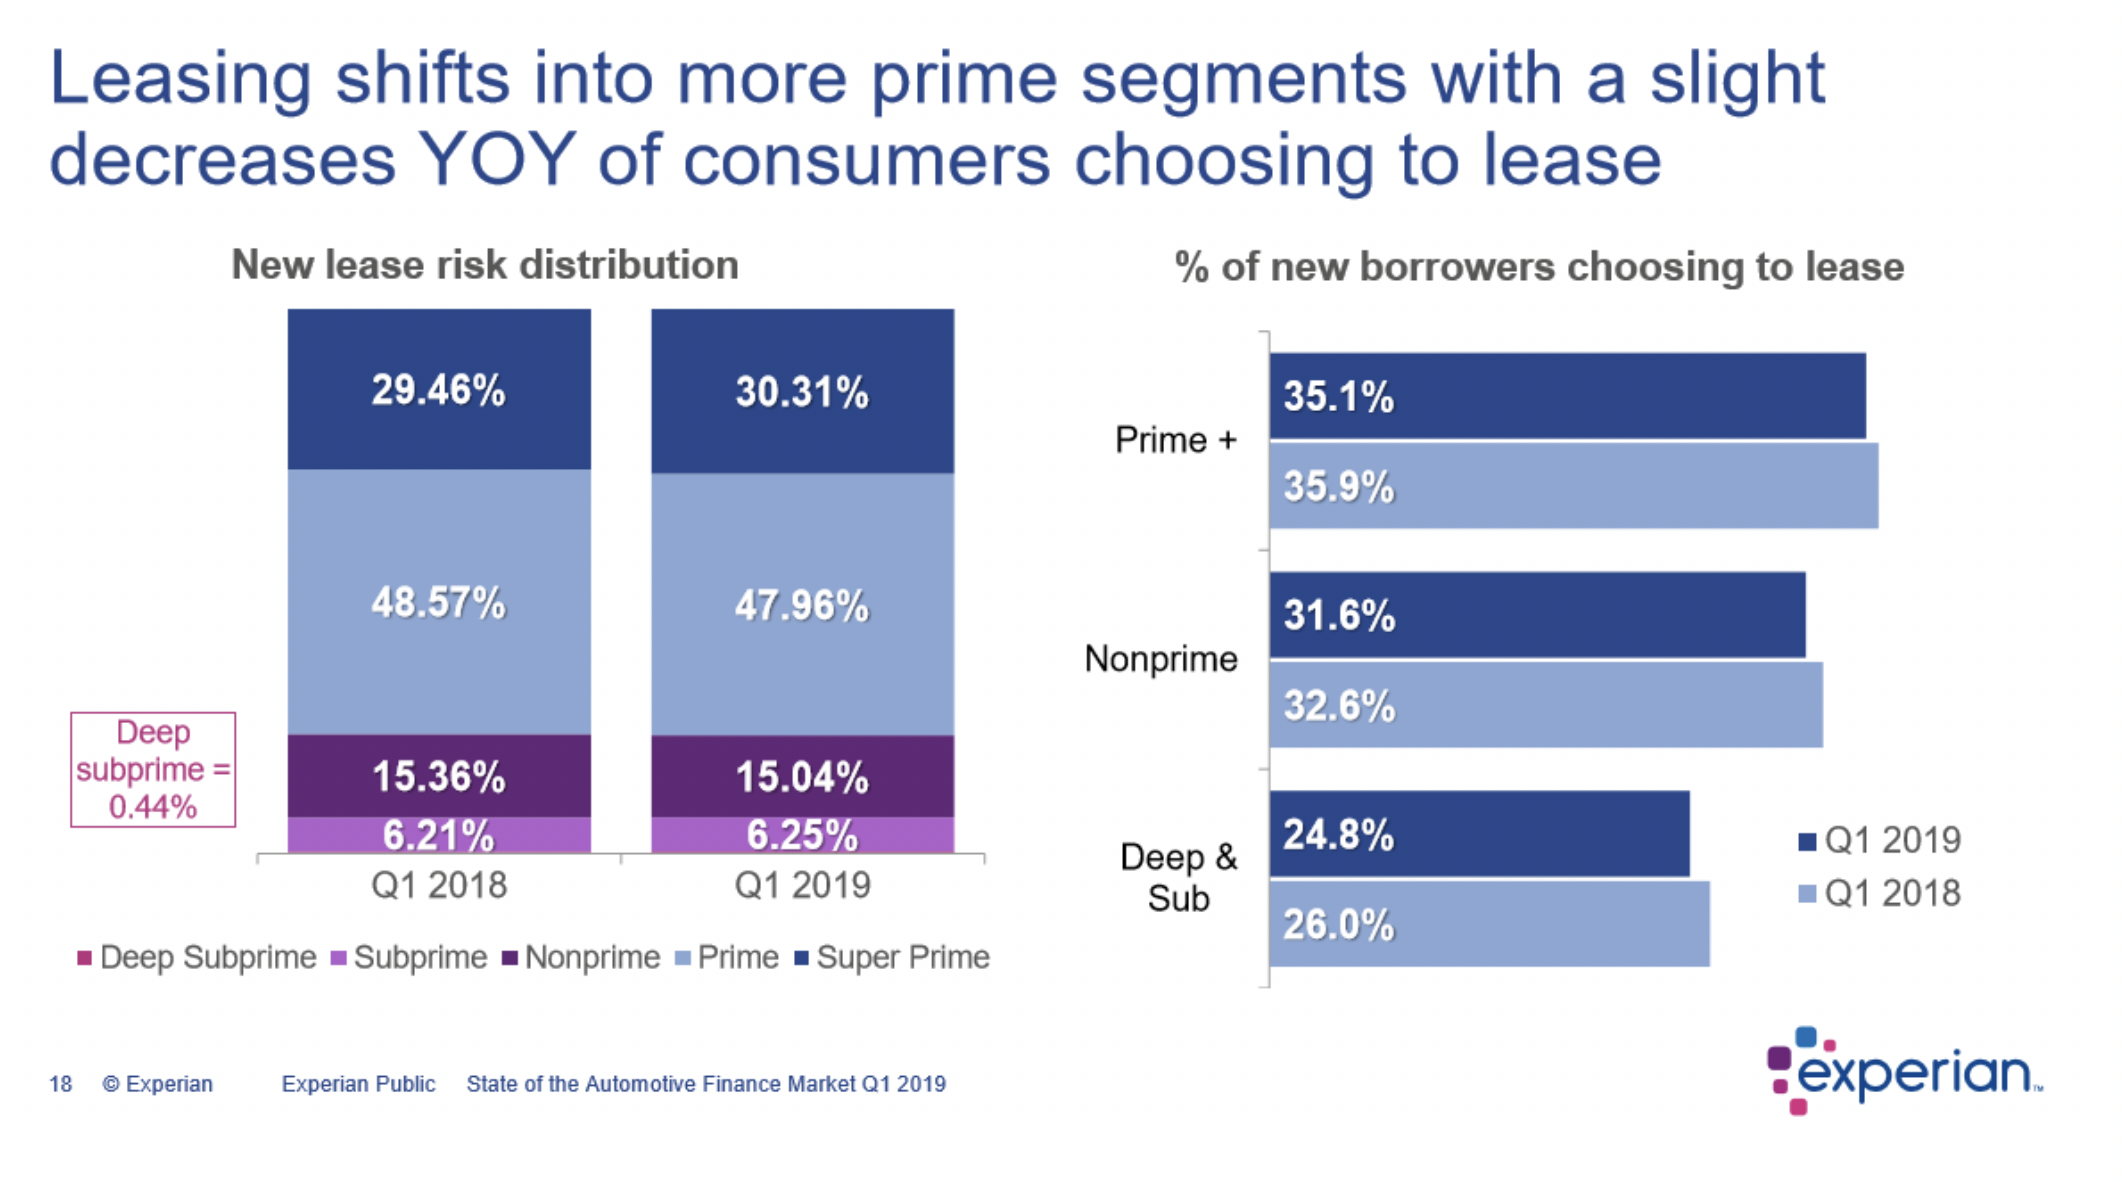
Auto Lease Activity
Car lease credit applicants registered a 72.4 percent approval rate in May, a slight increase from an April rate of 72 percent, according to Swapalease.com. The lease approval rate since January has continued to rise, with May being the strongest month of the year thus far.
“The approval rates in May surely reflect strength in the economy, as well as strength in consumer credit and spending habits,” said Scot Hall, executive vice president of Swapalease.com. “We’ve found that with dealers offering fewer incentives on new lease deals, consumers are searching for alternate means to obtain vehicles they desire. Secondary lease transfer marketplaces such as Swapalease continue to grow in popularity.”
Consumer Confidence
Consumer Confidence, as measured by The Conference Board, increased 3.8 percent in May. It was the first time this year that consumer’s confidence improved in back-to-back months, according to Manheim.
As a result of the two-month trend improving, the confidence index is at the highest level since November and is now higher than last year. according to Manheim. Plans to purchase a vehicle in the next six months also increased in May to a level that is now higher than at any point since the Great Recession.
“Consumer Confidence posted another gain in May and is now back to levels seen last Fall when the Index was hovering near 18-year highs,” said Lynn Franco, senior director of economic indicators for The Conference Board.
Employment gains were the primary reason for an increase in the Present Situation Index.
“Expectations regarding the short-term outlook for business conditions and employment improved, but consumers’ sentiment regarding their income prospects was mixed. Consumers expect the economy to continue growing at a solid pace in the short-term, and despite weak retail sales in April, these high levels of confidence suggest no significant pullback in consumer spending in the months ahead,” Franco added.
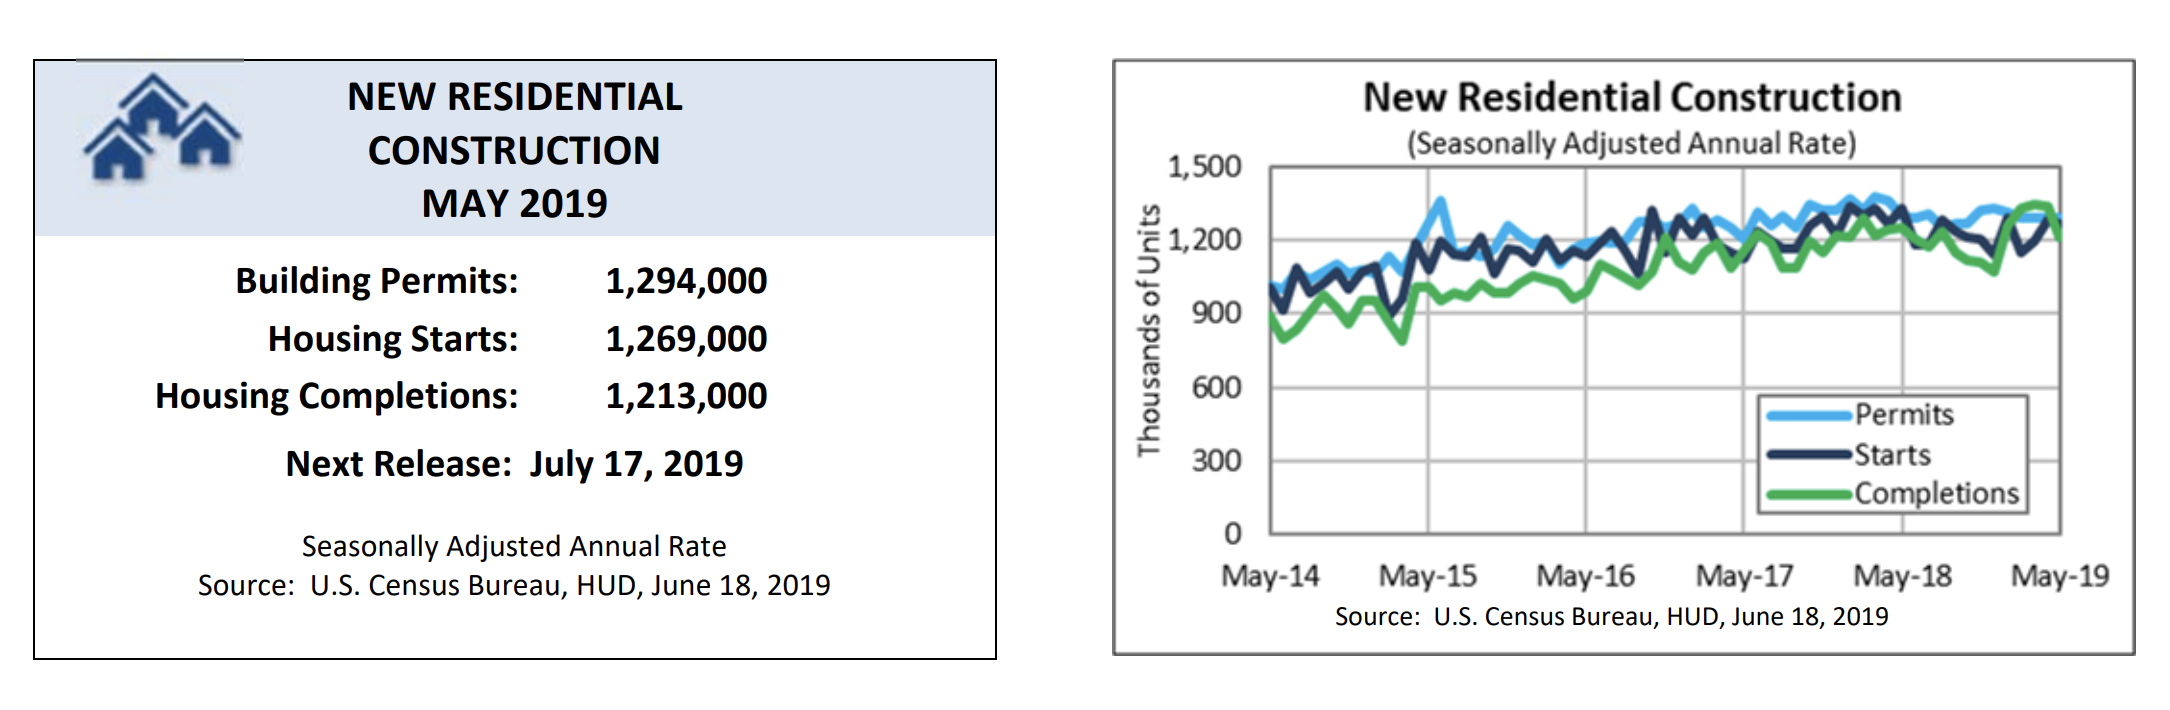
Housing Starts
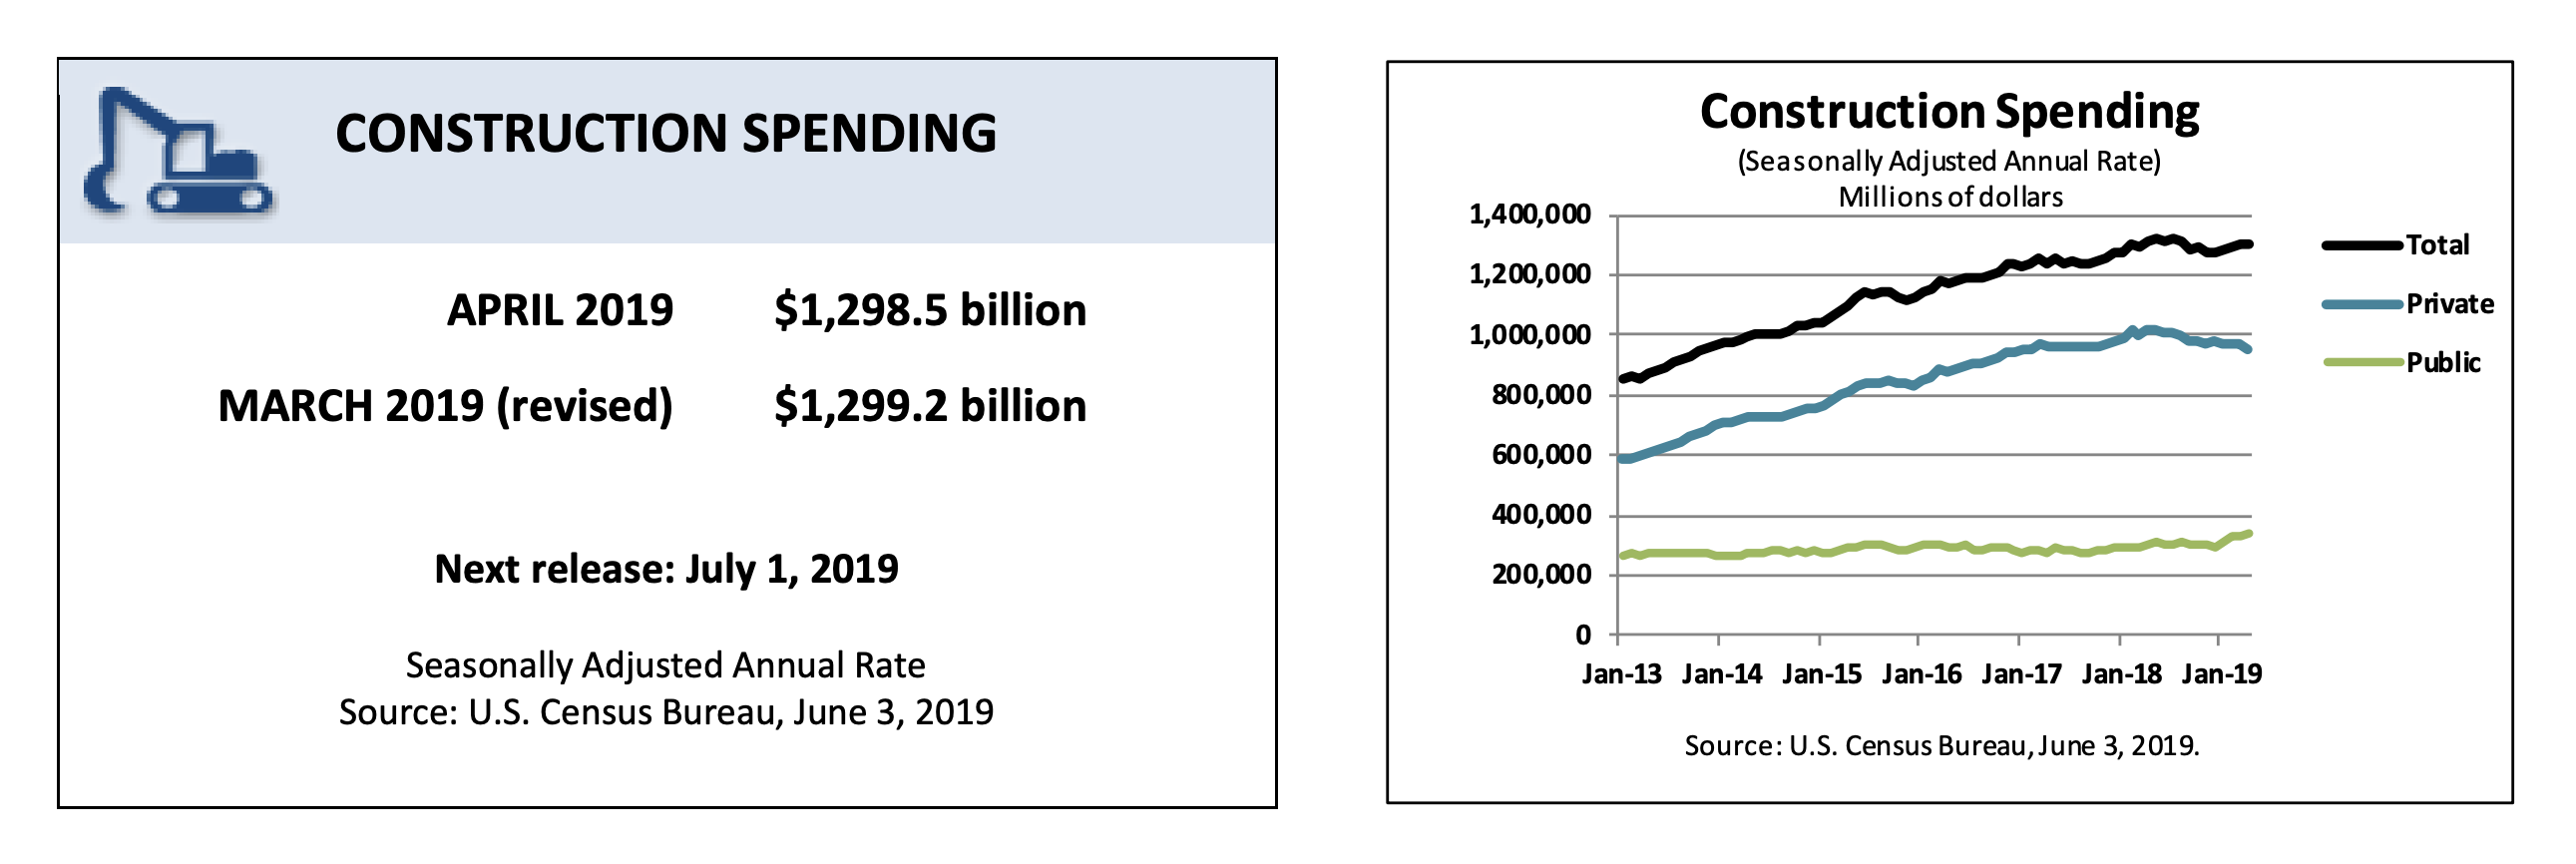
Construction Spending
Small Business Index
Small business optimism has eclipsed pre-government shutdown levels, increasing 1.5 points to 105.0 in May, according to the National Federation of Independent Business (NFIB) Research Foundation. Six components in the NFIB Small Business Optimism Index improved in May, while three remained unchanged and one dipped.
“Capital spending plans increased along with actual outlays. Small business owners’ expectations for sales, business conditions and expansion all rose, as the previously reported inventory imbalance was resolved. Earnings, job creation and compensation remained very strong,” NFIB reported.
Optimism among small business owners has surged to historically high levels thanks to strong hiring, investment and sales, according to Juanita D. Duggan, president and CEO of NFIB.
“The small business half of the economy is leading the way, taking advantage of lower taxes and fewer regulations, and reinvesting in their businesses, their employees, and the economy as a whole,” she said.
- NFIB analysis shows business owners reporting capital outlays increased six points to 64 percent, the highest reading since February 2018
- Thirty-percent plan capital outlays in the next few months, up three points and historically high
- Plans to invest were most frequent in transportation (45 percent), manufacturing (39 percent), professional services (39 percent) and construction (31 percent).
“Small business owners are demonstrating a continued confidence in the strength of the economy and are betting capital spending dollars on it,” said William Dunkelberg, NFIB chief economist. “This solid investment performance is supporting ongoing improvements in productivity and real wages.”
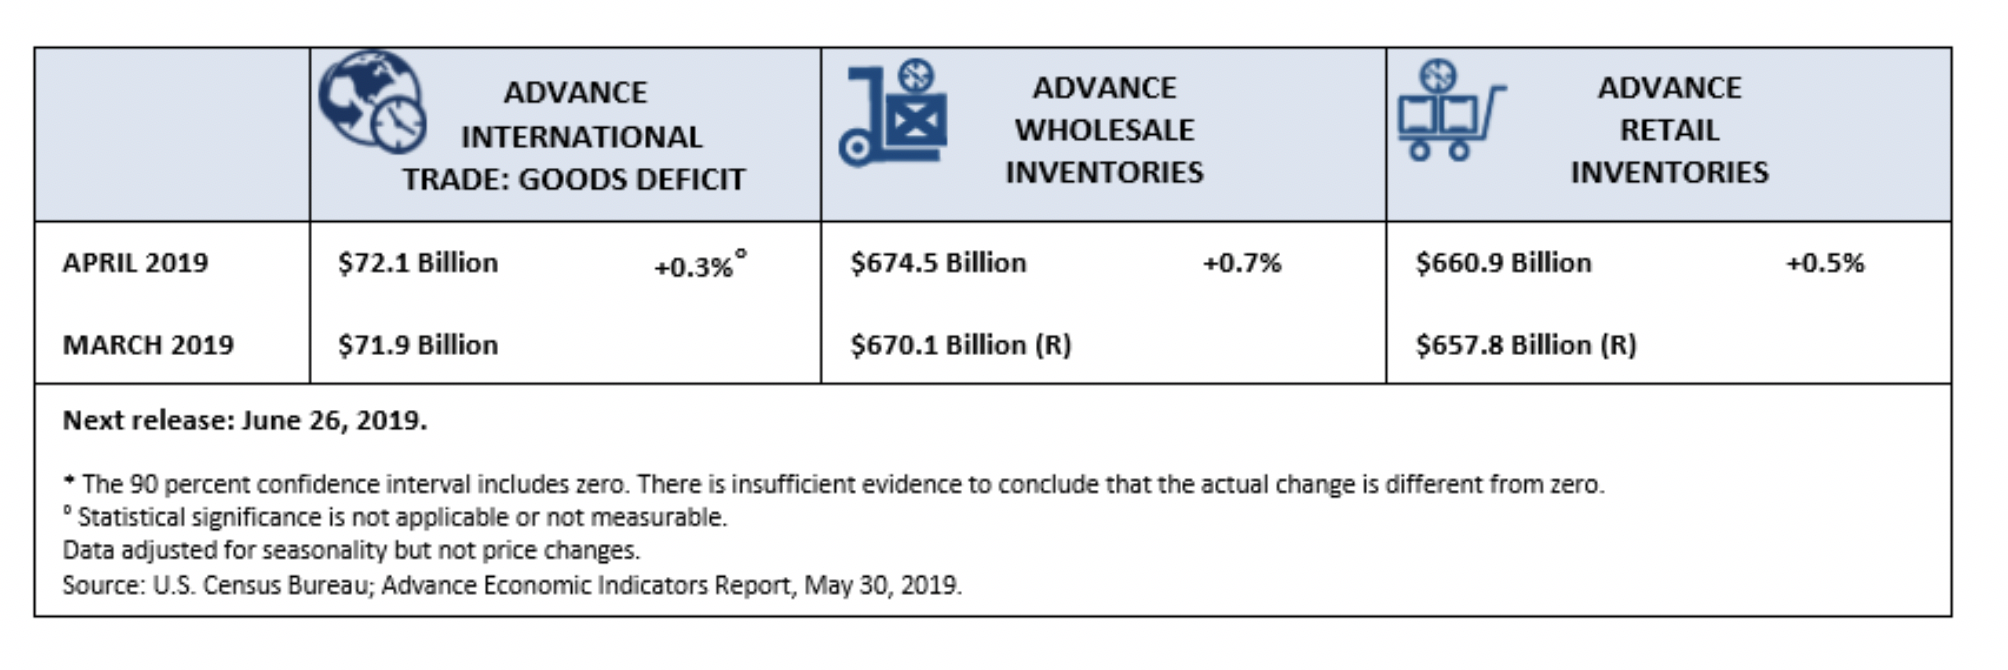
Retail and Wholesale Inventories
Manufacturing ISM
Manufacturing expanded in May and the general U.S. economy grew for the 121st consecutive month, according to the nation’s supply executives in the latest Manufacturing ISM Report On Business. The May PMI registered at 52.1 percent, a 0.7-percent decrease from the April reading of 52.8 percent.
The Report On Business measures its data using the Purchasing Manager’s Index (PMI), which is an indicator of economic health in the manufacturing sector. A reading above 50 percent indicates that the manufacturing economy is generally expanding, while below 50 percent indicates that it is generally contracting.
“Comments from the panel reflect continued expanding business strength, but at soft levels consistent with the early-2016 expansion,” said Timothy R. Fiore, chair of the Institute for Supply Management (ISM) Manufacturing Business Survey Committee. “Demand expansion continued, with the New Orders Index strengthening, but remaining in the low 50s, the Customers’ Inventories Index remaining at a too low level, and the Backlog of Orders Index contracting for the first time since January 2017. Consumption (production and employment) continued to expand, resulting in a combined PMI contribution of 0.3 percentage point. Inputs-expressed as supplier deliveries, inventories and imports-were lower this month, primarily due to inventory softening and supplier’s continuing to deliver faster, resulting in a combined 4.6-percentage point reduction in the Supplier Deliveries and Inventories indexes. Imports contracted for the second straight month. Overall, inputs reflect supply chains’ ability to respond faster and indicate that supply managers are closely watching inventories. Prices remain at a relatively stable level.
“Respondents expressed concern with the escalation in the U.S.-China trade standoff, but overall sentiment remained predominantly positive. The PMI continues to reflect slowing expansion,” Fiore added.
Of the 18 manufacturing industries, 11 reported growth in May in the following order: Printing & related support activities; furniture & related products; plastics & rubber products; textile mills; miscellaneous manufacturing; electrical equipment, appliances & components; computer & electronic products; chemical products; food, beverage & tobacco products; nonmetallic mineral products; and machinery.
The six industries reporting contraction in May, listed in order, were: Apparel, leather & allied products; primary metals; petroleum & coal products; wood products; paper products; and fabricated metal products.
- Commodities Up in Price: Aluminum*; dairy products; electronic components (10); integrated circuits; nylons; printed circuit board assemblies; solvents; steel* (9); and steel products*
- Commodities Down in Price: Aluminum* (2); caustic soda (2); memory (2); natural gas; polypropylene (3); scrap metal; soybean products; steel*; hot rolled steel (2); and steel products* (5)
- Commodities in Short Supply: Aluminum products (3); capacitors (2); electronic components (13) and integrated circuits.
*The number of consecutive months the commodity is listed is indicated after each item. *Indicates both up and down in price.
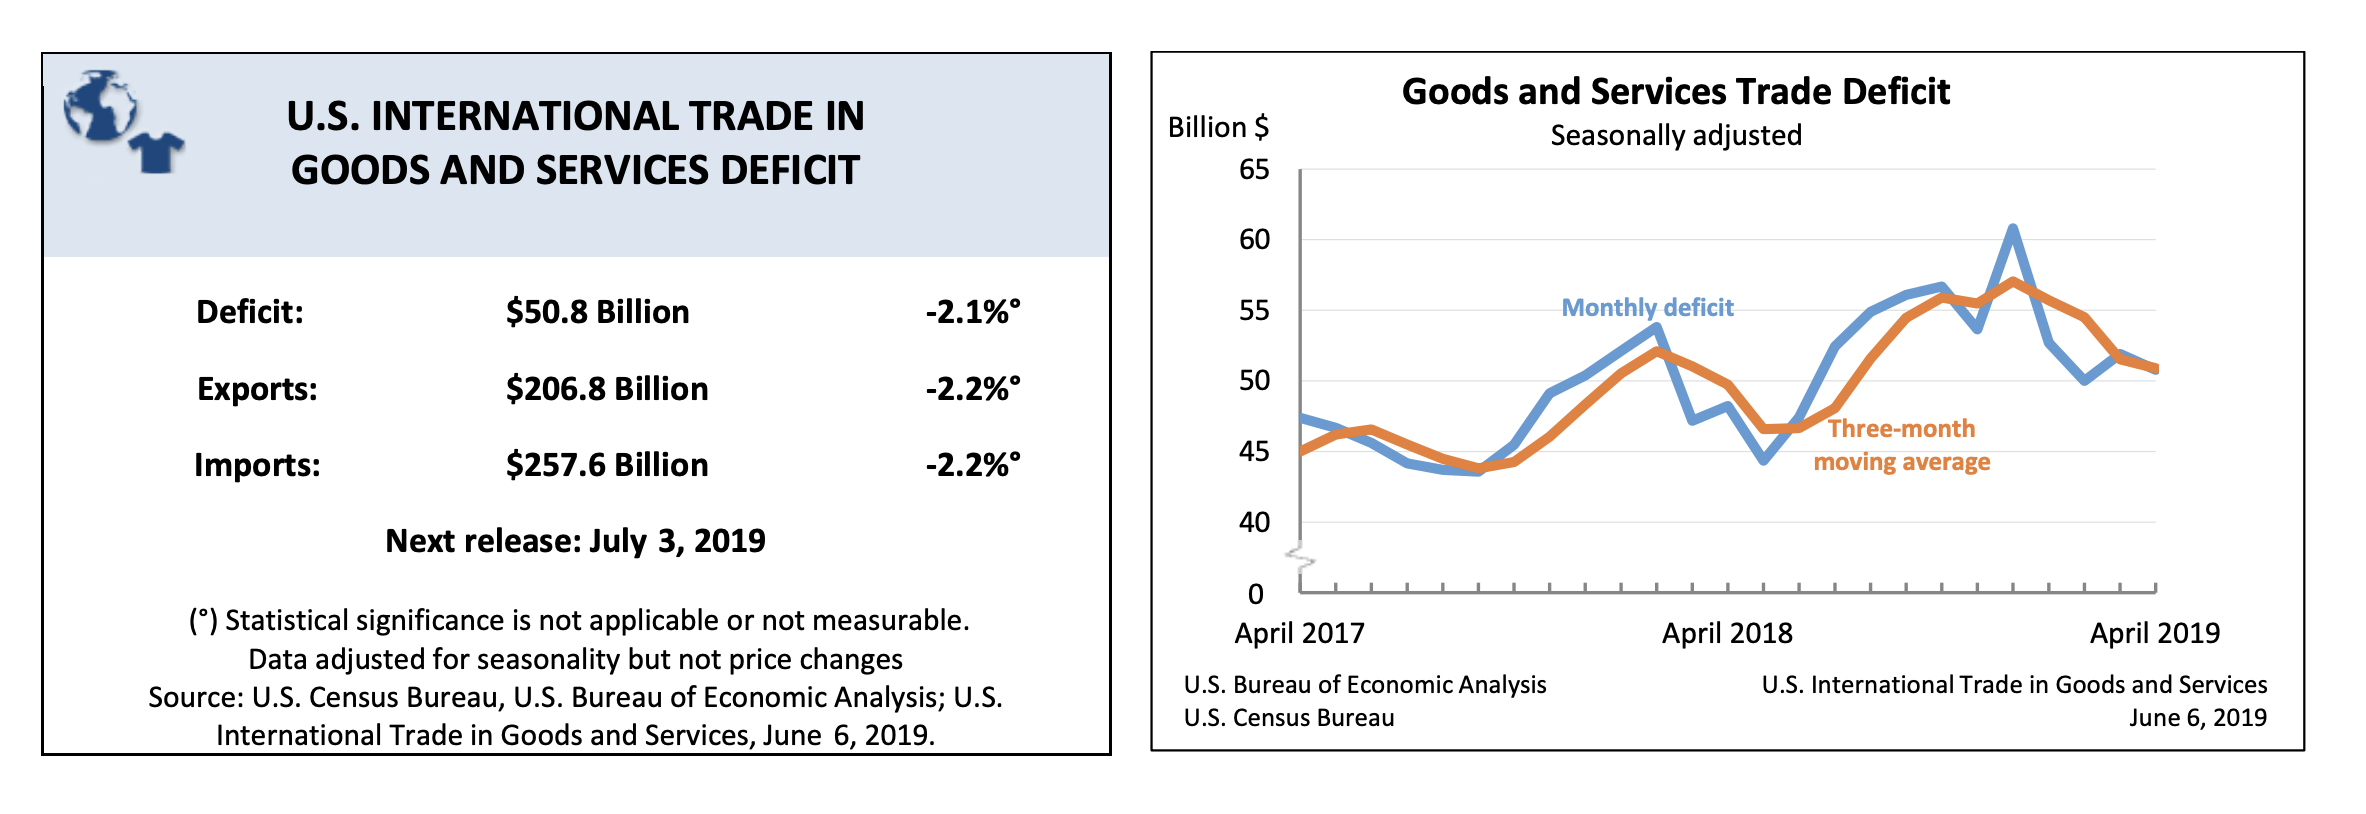
Import and Exports
The goods and services deficit was $50.8 billion in April, down $1.1 billion from the revised total of $51.9 billion in March, according to the U.S. Census Bureau and the U.S. Bureau of Economic Analysis. April exports were $206.8 billion, $4.6 billion less than March exports. April imports were $257.6 billion, $5.7 billion less than March imports.