Key Performance Indicators Report — December 2019

The Brief
The year 2019 was an unpredictable one. As unemployment hit record lows, consumer confidence wavered month-to-month with tensions running high from a U.S.-China trade war and increasing uncertainty associated with the pending Brexit battle. To date, the U.S. has imposed tariffs on more than $360bn (£268bn) of Chinese goods. Likewise, China has retaliated with tariffs on more than $110bn of U.S. products. 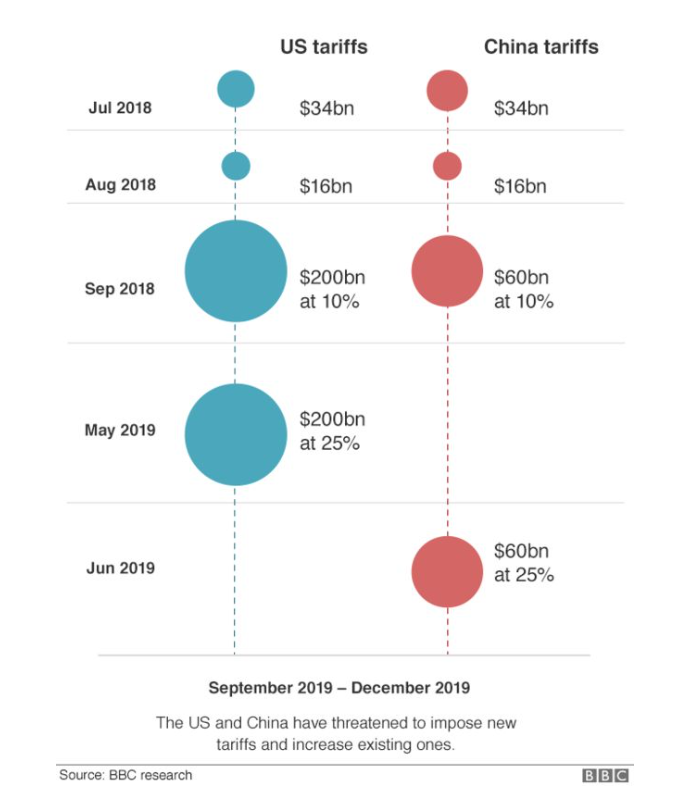
This trade war—regardless of serving as a display of strength on behalf of American values—has impacted businesses and weighed on the global economy, including the automotive industry. Recently, the countries announced a preliminary deal but, as BBC reported, some of the most challenging issues remain unresolved.
- The “phase one” agreement during December reduces some U.S. tariffs in exchange for more Chinese purchases of American products, and better protection for U.S. intellectual property.
- The deal is yet to be signed and tariffs of 25% on $250bn worth of Chinese goods remain in place. However, the U.S. will drop tariffs on $120bn worth of Chinese goods to 7.5%.
- Washington also shelved a planned round of tariffs, which would have hit Chinese smartphones, clothing and toys.
United States-Mexico-Canada Agreement
Other industry-related news includes The United States-Mexico-Canada Agreement (USMCA), a revamped version of NAFTA with a few key changes—some of which are vital for several of world’s largest automakers. “Updating the 1994 pact among the three nations, the new USMCA places more focus on current issues like intellectual property, fair labor, environmental protections and currency manipulation. Most important for the auto industry, however, are the production requirements necessary to avoid steep tariffs,” said automotive industry writer Joe Evans.
“According to the agreement, automakers could only qualify for zero tariffs if a car or truck has 75% of its parts manufactured in the U.S., Canada or Mexico—up from 62.5% under NAFTA. Additionally, under the USMCA, 70% of a vehicle’s steel and aluminum must come from North America in order to be duty-free,” he continued.
A last-minute amendment to the bill indicates that the steel must be melted and poured within these countries as well, a provision that would “complicate qualification for cars produced in Mexico, whose slabs often originate in Brazil, Japan and Germany,” according to Bloomberg.
“The intention was to close a loophole from 2018, which allowed foreign steelmakers to circumvent Section 232 tariffs by shipping to Mexico, where Mexican steelmakers would slightly change the product and then ship it to the U.S., thereby avoiding the tax. While the loophole is now ‘closed,’ a concession was made to provide time for Canadian and Mexican steel industries to adjust—an extension of seven years,” explained Evans.
Passage of the USMCA continues to gain momentum, as leaders from Canada, Mexico and our own congressional members have all now voiced strong support. I am encouraged by these developments, and look forward to more voices every day confirming what we already know: that the USMCA will further American prosperity, create more American jobs and fuel economic growth in communities across the continent. –U.S. Secretary of Commerce Wilbur Ross
Read more about this topic, including the fair labor component, here.
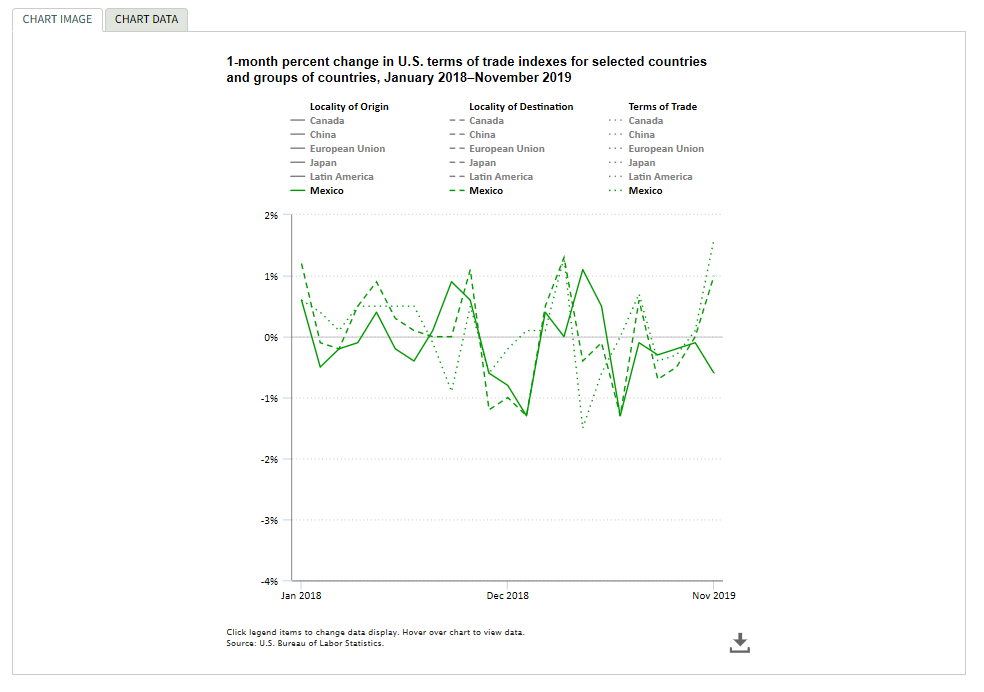
According to the Bureau of Labor Statistics, U.S terms of trade with Mexico rose 1.6% in November 2019, the largest monthly advance since the index was first published in December 2017. Prices for imports from Mexico declined 0.6% in November following a 0.1-percent drop in October. Prices for exports to Mexico increased 1% in November, the largest monthly increase since March 2019.
Manufacturing ISM
Economic activity in the manufacturing sector contracted in November, and the overall economy grew for the 127th consecutive month, said the nation’s supply executives in the latest Manufacturing ISM® Report On Business®. The November PMI® registered 48.1%, a decrease of 0.2 percentage point from the October reading of 48.3%.
The Report On Business measures its data using the Purchasing Manager’s Index (PMI), which is an indicator of economic health in the manufacturing sector. A reading above 50 percent indicates that the manufacturing economy is generally expanding, while below 50 percent indicates that it is generally contracting.
“Comments from the panel were consistent with the previous month, with sentiment improving compared to October. November was the fourth consecutive month of PMI® contraction, at a faster rate compared to the prior month. Demand contracted, with the New Orders Index contracting faster, the Customers’ Inventories Index remaining at ‘too low’ levels and the Backlog of Orders Index contracting for the seventh straight month (and at a faster rate). The New Export Orders Index returned to contraction territory, likely contributing to the faster contraction of the New Orders Index. Consumption (measured by the Production and Employment indexes) contracted, due primarily to lack of demand, but contributed positively (a combined 1.8-percentage point increase) to the PMI® calculation. Inputs — expressed as supplier deliveries, inventories and imports — were again lower in November, due primarily to contraction in inventories that was partially offset by supplier deliveries returning to ‘slowing,’” said Timothy R. Fiore, CPSM, C.P.M., Chair of the Institute for Supply Management® (ISM®) Manufacturing Business Survey Committee.
“This resulted in a combined 0.9-percentage point decrease in the Supplier Deliveries and Inventories indexes. Imports contraction softened. Overall, inputs indicate (1) supply chains are meeting demand and (2) companies are less confident that materials received will be consumed in a reasonable time period. Prices decreased for the sixth consecutive month, at a slower rate,” continued Fiore.
Global trade remains the most significant cross-industry issue. Among the six big industry sectors, Food, Beverage & Tobacco Products remains the strongest, while Fabricated Metal Products is the weakest. Overall, sentiment this month is neutral regarding near-term growth, according to the report.
Of the 18 manufacturing industries, five reported growth in November: Apparel, Leather & Allied Products; Food, Beverage & Tobacco Products; Paper Products; Miscellaneous Manufacturing; and Computer & Electronic Products. The 13 industries reporting contraction in November include the following: Wood Products; Printing & Related Support Activities; Furniture & Related Products; Textile Mills; Fabricated Metal Products; Transportation Equipment; Primary Metals; Plastics & Rubber Products; Petroleum & Coal Products; Nonmetallic Mineral Products; Machinery; Chemical Products; as well as Electrical Equipment and Appliances & Components.
- Commodities Up in Price: Steel—Hot Rolled* and Steel—Stainless (2)
- Commodities Down in Price: Aluminum (8), Base Oils, Caustic Soda (2), Freight (2), Polypropylene, Steel (5), Steel—Hot Rolled* (4), Steel—Scrap (2) and Steel Products (11)
- Commodities in Short Supply: Electrical Components (2)
Note: The number of consecutive months the commodity is listed is indicated after each item. *Indicates both up and down in price.
New Export Orders*
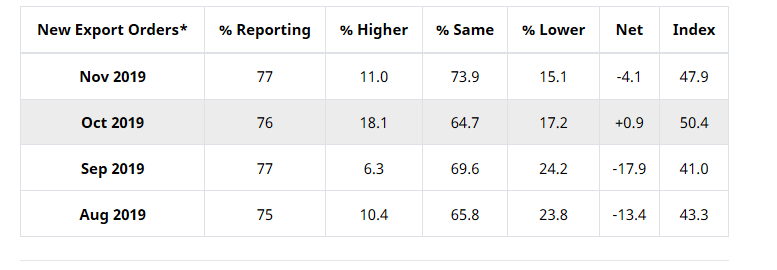
ISM®’s New Export Orders Index registered 47.9% in November—a decrease of 2.5 percentage points compared to the October reading of 50.4%—indicating that new export orders contracted after growing in October. “The index returned to contraction territory, which contributed negatively to the New Orders Index. Three of the six big industry sectors expanded, and two contracted during the period. Transportation Equipment continues to contract strongly,” explained Fiore.
The five industries reporting growth in new export orders during November include Food, Beverage & Tobacco Products, Computer & Electronic Products, Paper Products, Miscellaneous Manufacturing and Chemical Products. The six industries reporting a decrease in new export orders during November include Wood Products, Nonmetallic Mineral Products, Transportation Equipment, Plastics & Rubber Products, Fabricated Metal Products and Machinery. Seven industries experienced no change in new export orders during the reporting period.
Imports*
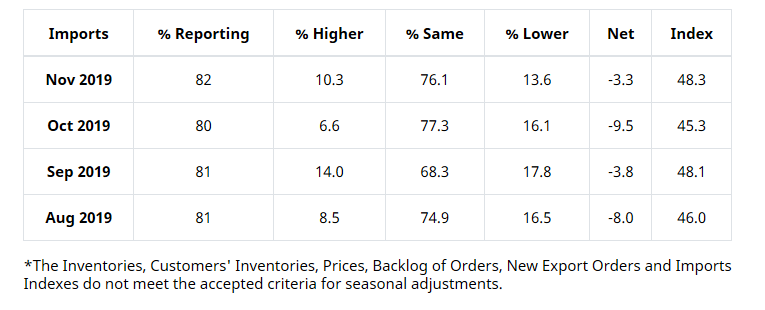
ISM®’s Imports Index registered 48.3% during November—3 percentage points higher when compared to the 45.3% reported for October—indicating that imports contracted for the fifth consecutive month. “Three of the six big industry sectors contracted, with one expanding during the period. Respondents continued to note a need to place orders in advance of the Lunar New Year season in Asia,” explained Fiore.
The six industries reporting growth in imports during November include Wood Products, Furniture & Related Products, Paper Products, Plastics & Rubber Products, Computer & Electronic Products and Machinery. The nine industries reporting a decrease in imports include Apparel, Leather & Allied Products, Printing & Related Support Activities, Textile Mills, Electrical Equipment, Appliances & Components, Nonmetallic Mineral Products, Transportation Equipment, Miscellaneous Manufacturing, Chemical Products and Fabricated Metal Products.
State of the Economy
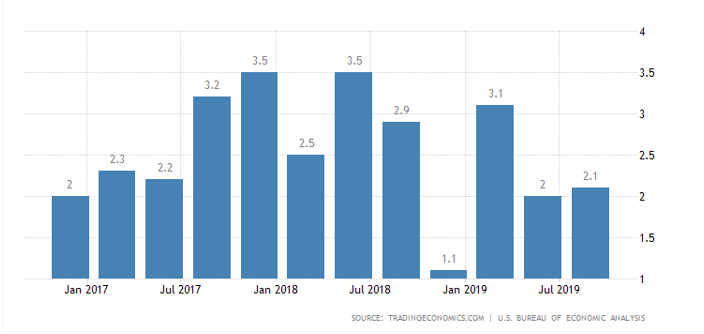
The U.S. Bureau of Economic Analysis announced the economy grew by an annualized rate of 2.1% in Q3, unchanged from the second estimate and following a 2% expansion in the previous three-month period. “The increase in real GDP in the third quarter reflected positive contributions from PCE, federal government spending, residential investment, exports and state and local government spending that were partly offset by negative contributions from nonresidential fixed investment and private inventory investment. Imports, which are a subtraction in the calculation of GDP, increased.”
Employment & Wage Summary
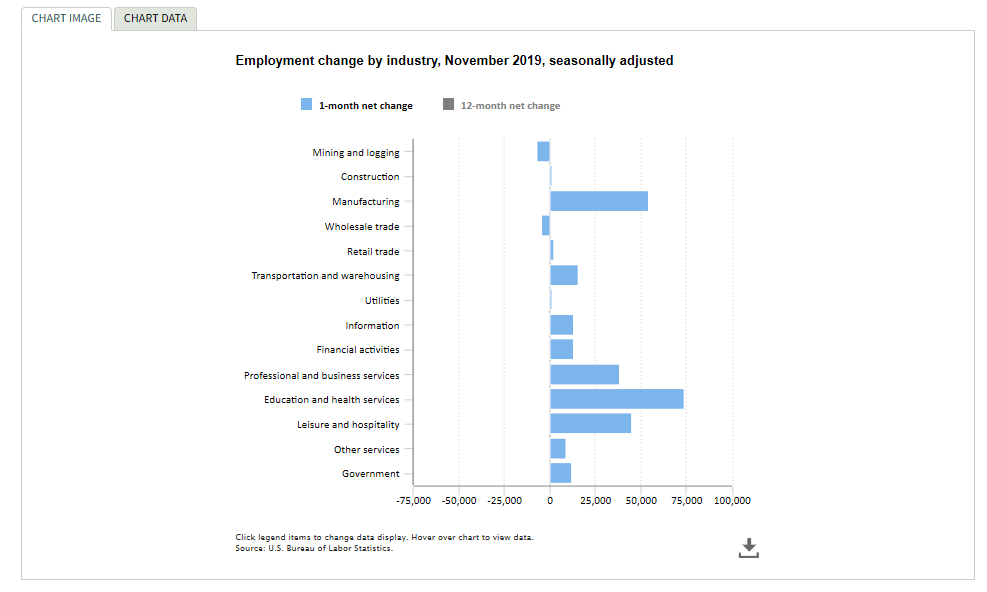
The U.S. unemployment rate decreased to 3.5% during November 2019. Total nonfarm payroll employment rose by 266,000 in November 2019, with job growth averaging 180,000 per month compared to an average monthly gain of 223,000 in 2018.
The number of people who experienced some unemployment during 2018 declined by 1.3 million to 13.2 million. The share of those who worked or looked for work during the year fell by 0.8 percentage point to 7.8% in 2018. That was the lowest rate in the history of the series. In 2018, 168.6 million people worked or looked for work at some time during the year, an increase of 1.1 million from 2017.
Important takeaways from recent reporting, courtesy of the Bureau of Labor Statistics:
- Employment in leisure and hospitality continued to trend up (+45,000). The industry added 219,000 jobs over the last 4 months and 420,000 over the year.
- Employment in transportation and warehousing continued on an upward trend in November 2019 (+16,000). Within the industry, job gains occurred in warehousing and storage (+8,000) and in couriers and messengers (+5,000). Over the year, employment in transportation and warehousing increased by 73,300.
- Employment in other major industries showed little change during November, including construction, wholesale trade, information and government.
- Real average hourly earnings for all employees on private nonfarm payrolls increased 1.1% from November 2018 to November 2019. The increase in real average hourly earnings and no change in the average workweek resulted in a 1.1% increase in real average weekly earnings over the 12 months ending in November 2019.
The Voice of a Consumer
Though overall consumer confidence declined for the fourth consecutive month, data confirms improved consumer sentiment, consumer spending and consumer price index amid mixed conditions. Expert feedback includes:
- “Consumer confidence declined for a fourth consecutive month, driven by a softening in consumers’ assessment of current business and employment conditions,” said Lynn Franco, senior director of economic indicators at The Conference Board. “The decline in the Present Situation Index suggests that economic growth in the final quarter of 2019 will remain weak. However, consumers’ short-term expectations improved modestly, and growth in early 2020 is likely to remain at around 2%. Overall, confidence levels are still high and should support solid spending during this holiday season.”
- “Consumer sentiment improved in November based on the final data for the month from the University of Michigan. The consumer sentiment index increased 1.4%, but left consumer sentiment slightly lower than this time last year. The reading on current conditions declined, but the reading on expectations improved. Home sales activity strengthened this spring and summer aided by lower mortgage rates, and October saw a rebound in existing home sales following a decline in September. The seasonally adjusted annualized rate (SAAR) of existing home sales increased 1.9% in October from September, and existing home sales are up over last year by 4.6%. The residential real estate market’s biggest challenge is supply, which will eventually be aided by the increasing volume of permits and starts. The inventory of existing homes for sale was down in October by 4.3% from a year ago,” explained Manheim.
- Consumer spending accounts for an impressive 70% of U.S. economic output. Americans increased their spending in November at the fastest pace in four months, and income growth rebounded to its strongest gain since August, reported The Commerce Department. As a result, the savings rate fell to 2.9% of after-tax income in November, lowest since November 2007.” Consumer spending rose at a 0.4% annual rate last month, led by a jump in spending on durable goods like autos. It was up from a more modest annual gain of 0.3% in October, and it was the best showing since July. “American consumers stepped up their spending last month, a good sign for the holiday shopping season,” according to BNN Bloomberg. “Consumer spending rose a sharp 0.6% from October, outpacing a 0.3% increase in personal income.”
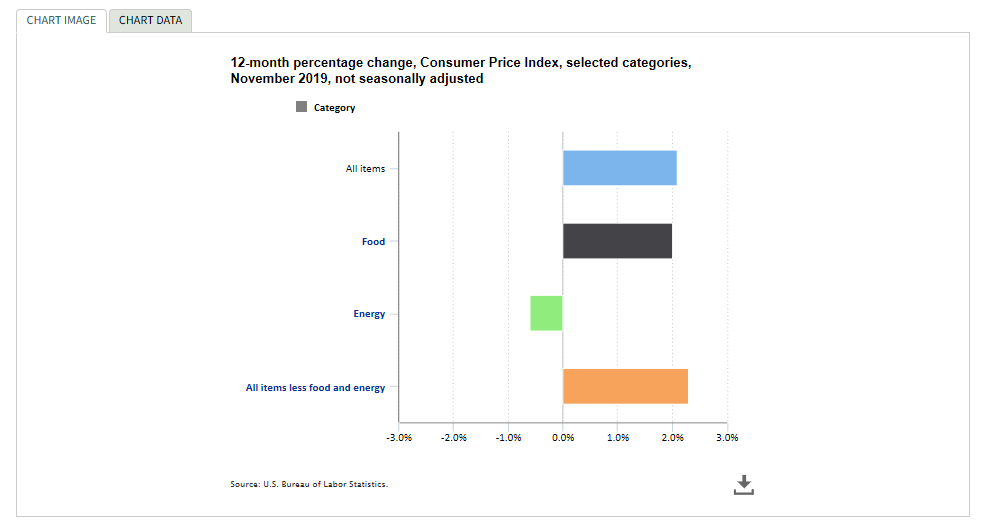
- The Consumer Price Index for All Urban Consumers increased 2.1% year-over-year during November—a rise from the 1.8% increase during October. Of particular interest, gasoline prices fell 1.2% and fuel oil prices decreased 6.7% over the year. In contrast, natural gas prices rose 1.1% and electricity prices increased 0.5%.
Takeaway: Economic growth in the United States will continue in 2020, say the nation’s purchasing and supply management executives in the December 2019 Semiannual Economic Forecast.
New & Used Vehicle Sales
November total new vehicle sales were up 2.1% year-over-year, with one more selling day compared to November 2018. The November SAAR came in at 17.1 million, a decline from last year’s 17.4 million but up from October’s 16.5 million rate, according to Manheim. The decline in sales represented by sedans continues, as car share in November was 26%. New vehicle inventories came in under 4 million units for the seventh consecutive month. 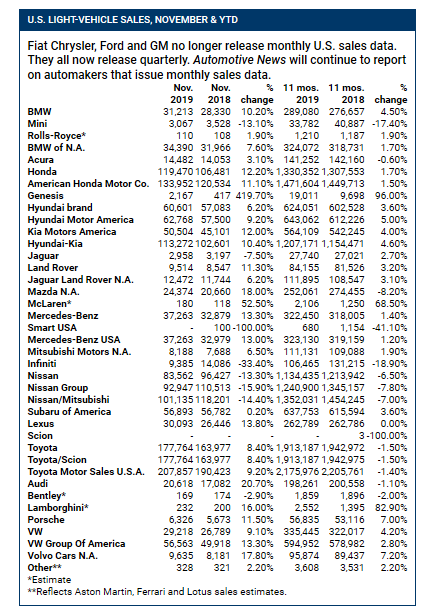
The seasonally adjusted, annualized rate of sales for November come in at 17.05 million, a rebound from October’s 16.55 million pace, which was hampered by a 40-day strike at General Motors. The SAAR reached 17.5 million in November 2018 and has now topped 17 million in six of the first 11 months this year. –Automotive News
Toyota Motor Corp., Honda Motor Co., Hyundai, Subaru and Kia experienced a much-needed boost in U.S. sales last month. “Overall, light-vehicle demand rose an estimated 1.4% in November, according to Automotive News data center estimates, and in line with forecasts from J.D. Power-LMC and ALG. Demand was helped by an extra sales day and weekend, heavy holiday promotions and rising incentives that reached record levels during the month,” according to David Phillips at Automotive News.
Strong fleet sales have supported the new vehicle market this year, but growth is slowing down. Combined rental, commercial and government purchases of new vehicles were down 9.3% year-over-year during November. Retail sales of new vehicles were up 4.1% in November, leading to a retail SAAR of 14.9 million, up from 14.8 million last November and the strongest retail SAAR of 2019. Fleet sales are up 3.2% in 2019 through November, and retail sales are down 1.7%, as the overall new vehicle market is down 0.9% this year. –Manheim.
Fleet sales are up significantly in 2019, as they were in 2018, and these gains have been supporting an otherwise declining new-car market. With significantly higher fleet deliveries over the last two years, further growth in 2020 will be challenging –Cox Automotive.
Year-End Estimates
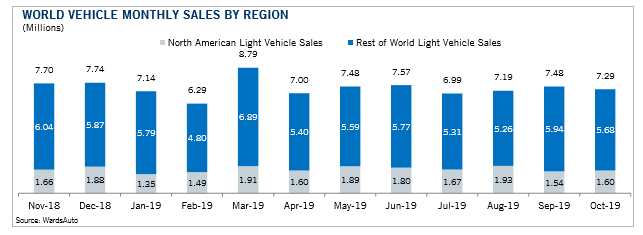
Global car sales are expected to decline by approximately 3.1 million in 2019, according to Fitch Ratings—citing data collected by the International Organisation of Motor Vehicle Manufacturers. The slowdown in auto sales is contributing to a drag on global manufacturing, reported the economics team at Fitch Ratings.
“The downturn in the global car market since the middle of 2018 has been a key force behind the slump in global manufacturing and the car sales picture is turning out a lot worse than we expected back in May,” explained Brian Coulton, chief economist at Fitch Ratings.
The Detroit 3 are expected to finish near or slightly below forecast data—projected November declines of 5.5% at GM, 2.7% at Ford and 3.5% at Fiat Chrysler—as lower car shipments continue to undermine their results, reported Cox Automotive.
Additionally, there is a record-breaking number of off-lease vehicles (typically three-year-old cars with less than 50,000 miles) flooding the market this year. Manheim estimates that by the end of 2019, 4.1 million off-lease vehicles will be on sale, compared to only 1.5 million in 2012. Among all retail used-car sales at dealerships, Manheim estimates they will increase from 19.5 million in 2019 to 20 million next year.
“That puts heavy pressure on new-car sales. For shoppers, more used cars mean prices will drop for most mainstream vehicles even as new-car prices for similar models will inevitably rise. (Certified pre-owned vehicles net a bigger profit for dealerships than the automakers, which generate revenue from their finance arms.) For automakers, flat or declining monthly sales may cause them to lower production in 2020 to compensate for lower demand,” according to Car and Driver.
As for the U.S., year-end incentives generally rise at the end of the year, with OEMs trying to liquidate old inventory to make way for new products. “Black Friday and year-end sales promotions have become an important part of the sell-down strategy and are even more important in a downward moving retail market,” Cox Automotive. Expect incentives to play a key role in year-end sales data.
Other takeaways, courtesy of Phillips, include:
- J.D. Power and LMC estimate average incentive spending was on pace to reach $4,538 per vehicle last month, an increase of more than 12% from November 2018 and the first-time discounts topped $4,500.
- ALG estimates average November incentives rose 1.2% to $3,759, with the biggest discounts among major automakers offered by the Detroit 3, Daimler, BMW and Nissan. Many Honda dealers dangled red-tag discounts on older new vehicles and Buick offered 20% off MSRP.
- The increase in incentive spending is being driven by record levels of older-model vehicles still lingering on dealer lots, analysts say.
- Discount spending on 2020 model-year vehicles was on pace to reach $3,723 in November, an increase of nearly 13% from a year ago, J.D. Power and LMC said.
Despite some uncertainty, “Strong labor and equity markets continue to provide the foundation for robust vehicle demand. Until either of those changes substantially, strong vehicle markets are likely to continue,” said Charlie Chesbrough, senior economist at Cox Automotive.
Manheim Used Vehicle Index
According to Cox Automotive estimates, total used vehicle sales volume was down 2.7% year-over-year during November 2019. Manheim estimates the used SAAR to be 39.7 million, which is a decrease of 40.8 million compared to last November and up from October’s 39.6 million rate. The November used retail SAAR estimate is 19.3 million, a decline from 19.4 million last year and down month-over-month from October’s 20.6 million rate.
Important takeaways, courtesy of Manheim:
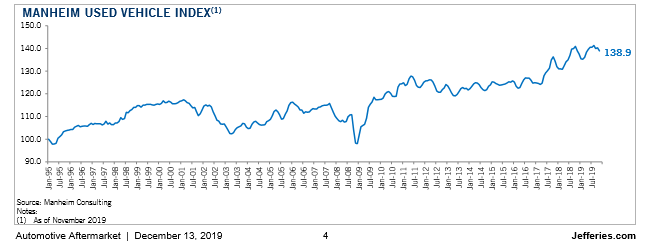
- Wholesale used vehicle prices (on a mix-, mileage- and seasonally adjusted basis) decreased 0.98% month-over-month during November 2019. This brought the Manheim Used Vehicle Value Index to 138.9, a 0.1% decrease from a year ago, and the second consecutive year-over-year decline for the Index.
- Three-year-old vehicle values in aggregate were down 1.6% for the month. As a result of the higher depreciation pattern from September through mid-November, prices in aggregate relative to the beginning of the year continue to be lower than either of the last two years.
- On a year-over-year basis, most major market segments saw seasonally adjusted price declines in November. Midsize cars and luxury cars outperformed the overall market, while most other major segments underperformed the overall market.
- Last year remains a challenging comparison for prices, coming off a record in the Manheim Index because of abnormally strong consumer demand in the fall related to tariff fears and rising interest rates.
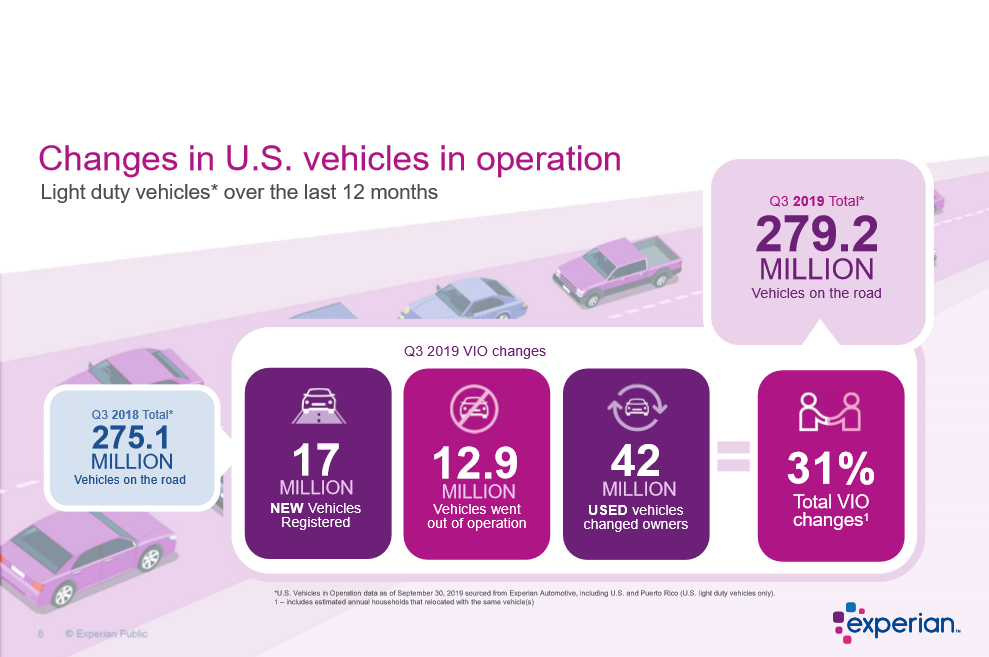
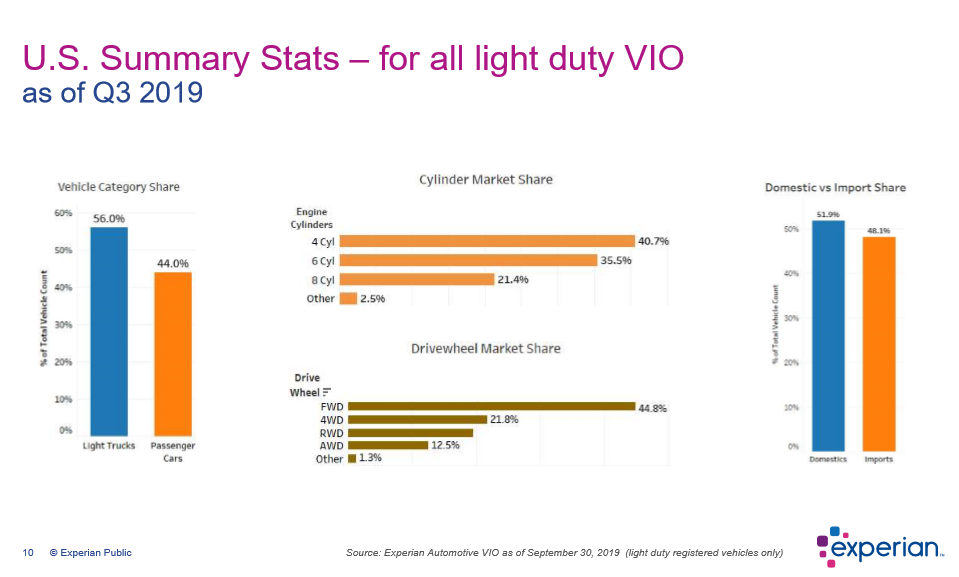
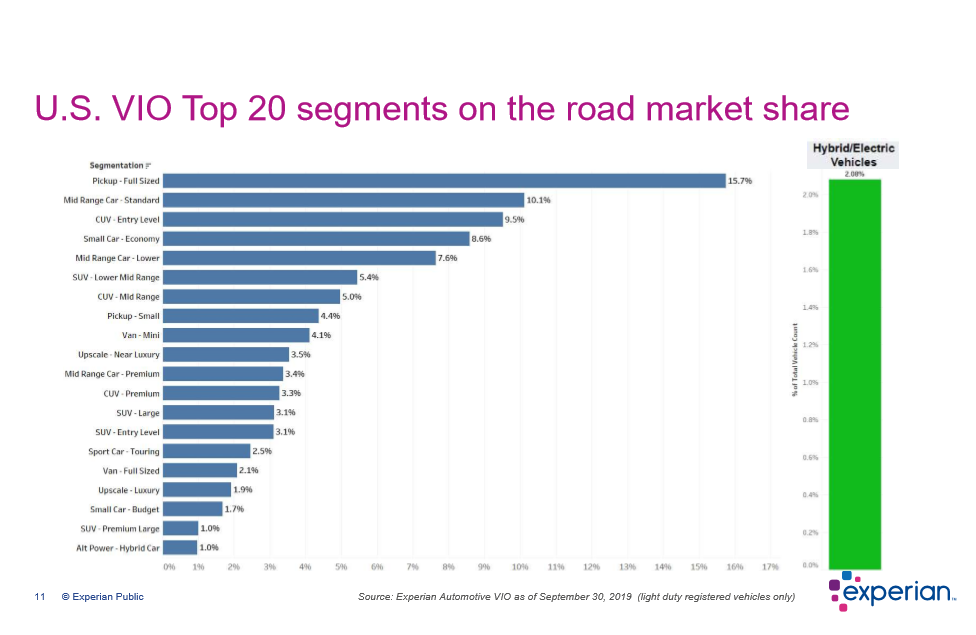
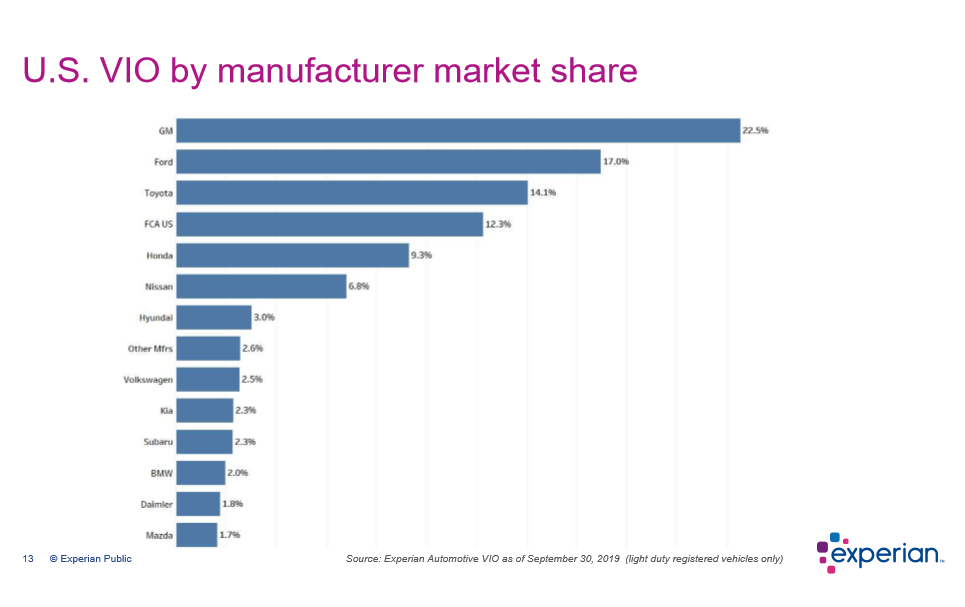
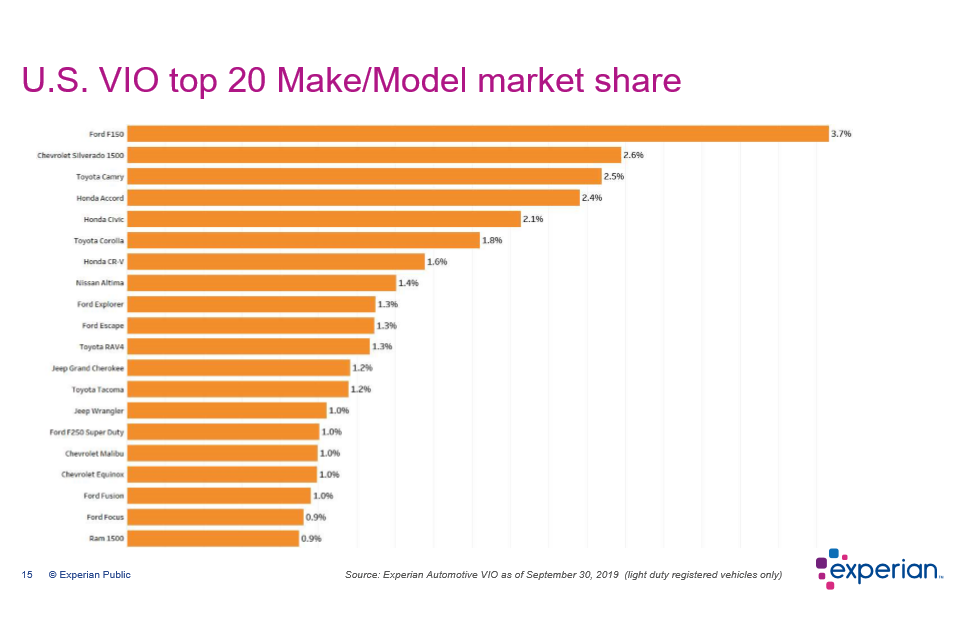
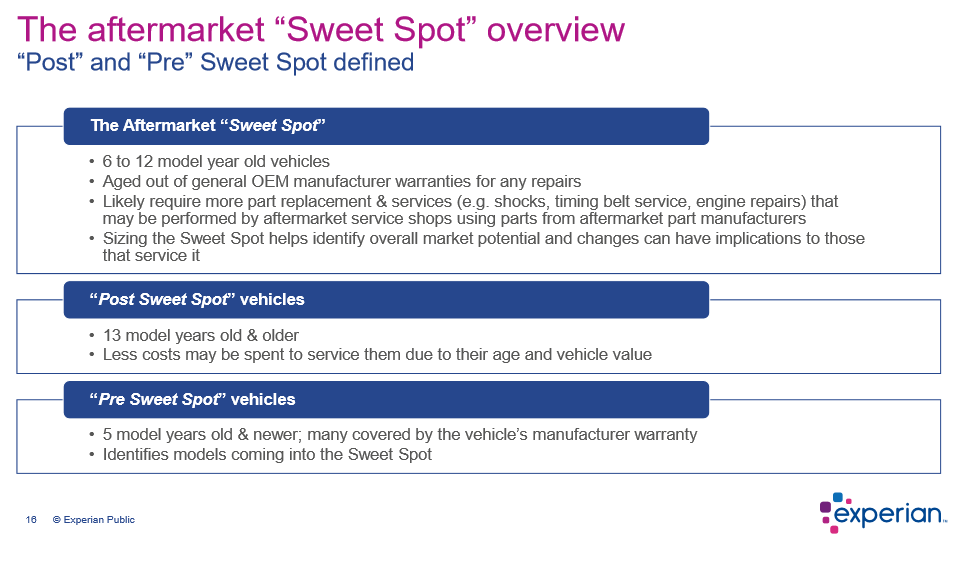
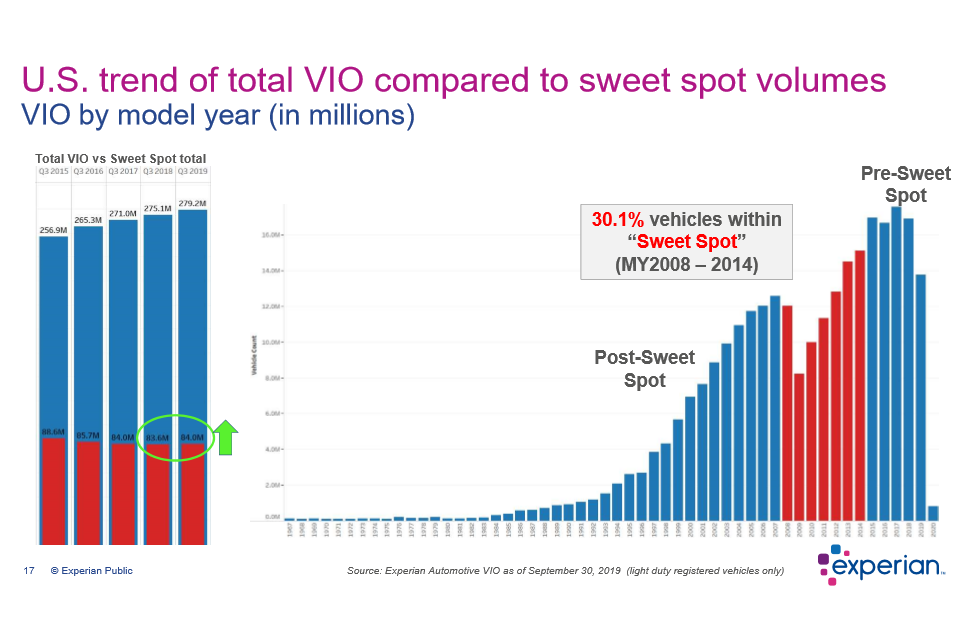
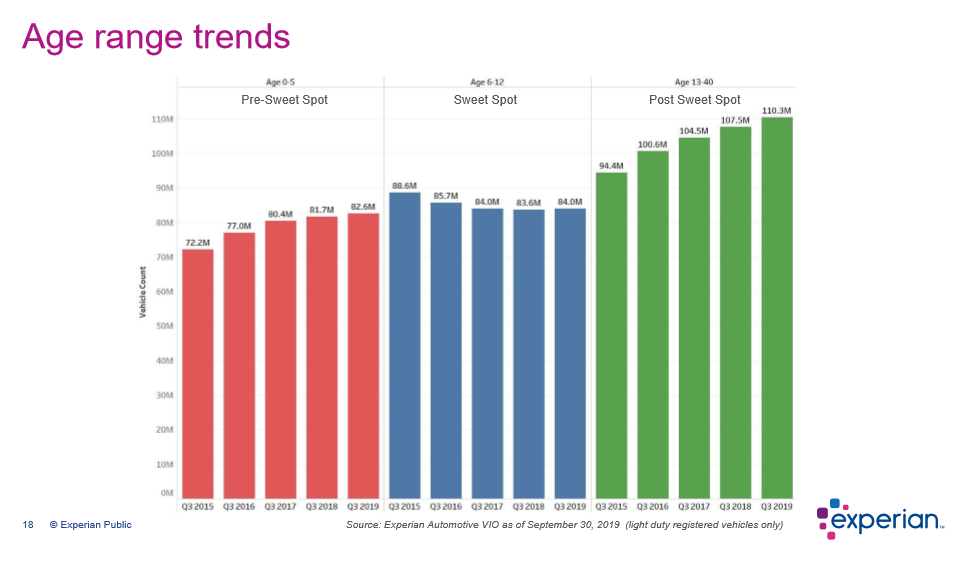
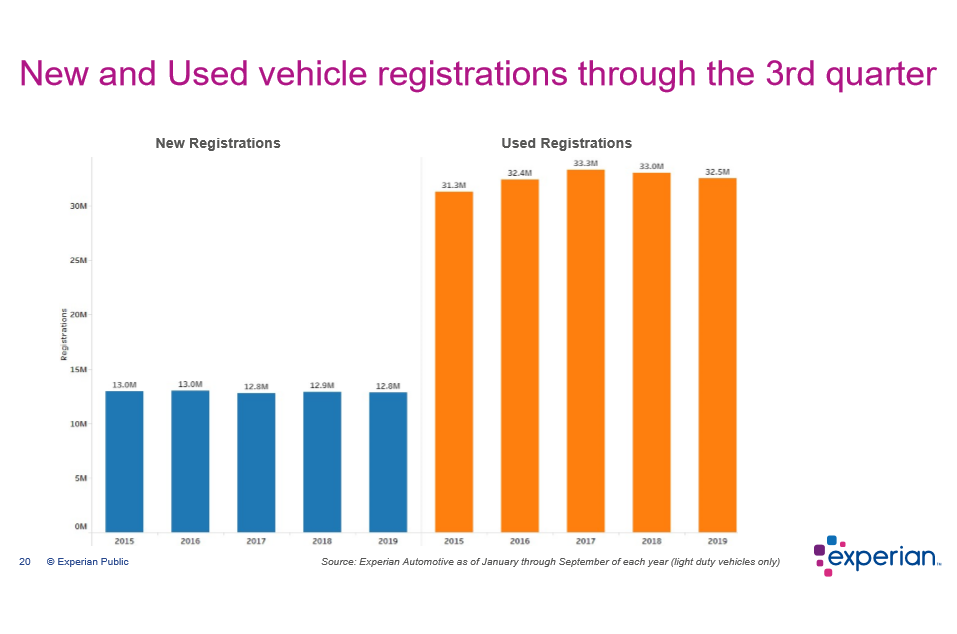
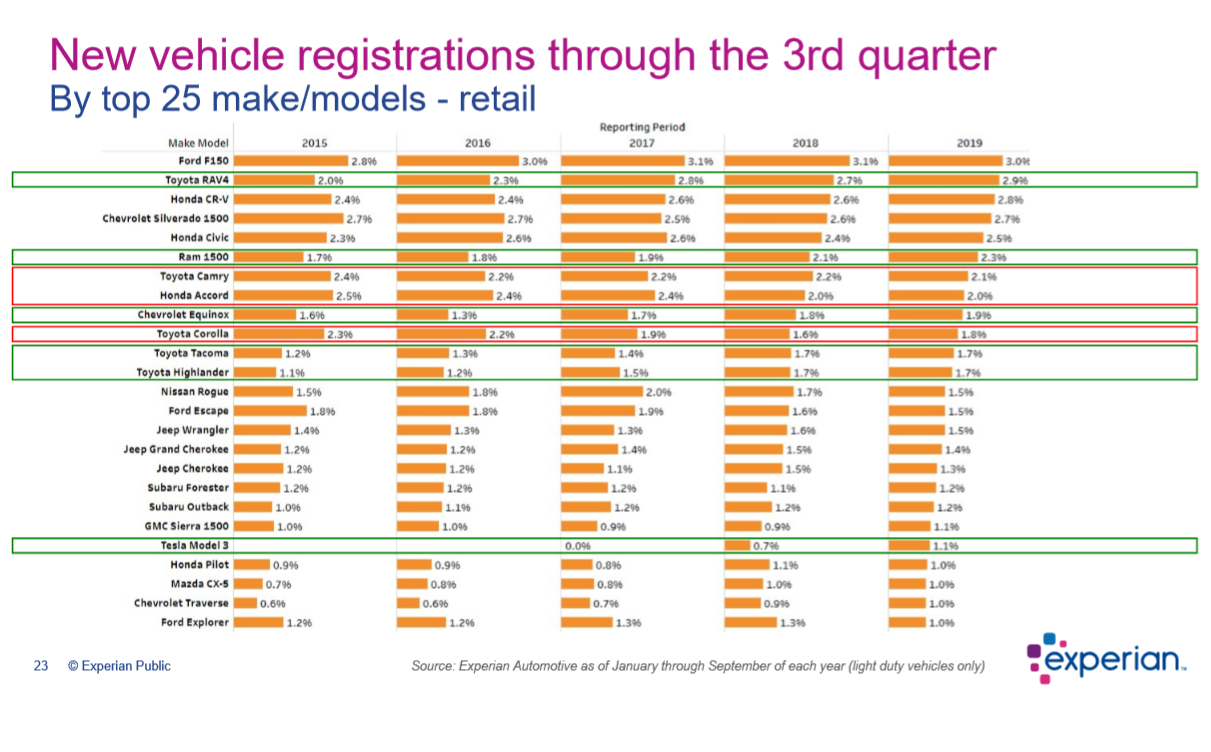
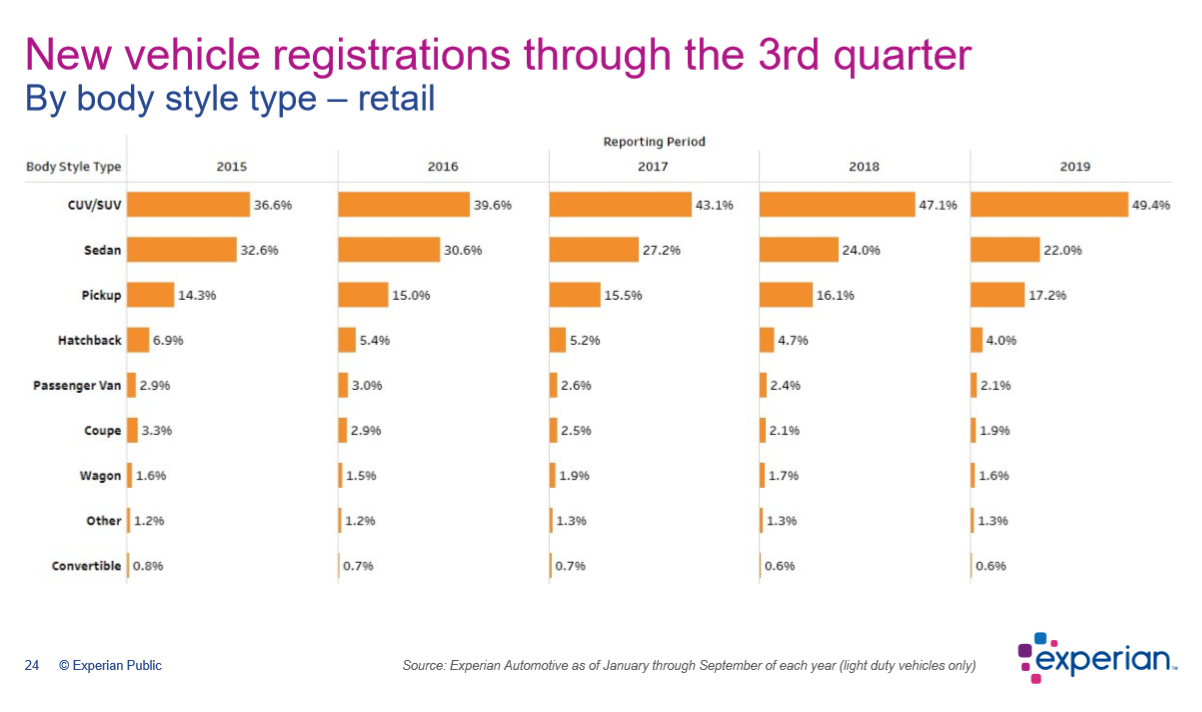
Experian publishes a quarterly report about the automotive industry, providing a comprehensive view of vehicle market activity, such as registration sales, vehicles in operation, demographic data and trends. The Q3 presentation data below is courtesy of Experian and most impactful when analyzed alongside the new and used vehicle information listed above.
Automotive Aftermarket
As reported in the Key Performance Indicator Report – November 2019, e-commerce sales continue to impact traditional retail. In fact, e-commerce holiday season sales alone are projected to reach 135.35 billion U.S. dollars this year, an increase of 13.2% compared to 2018 and clear indication of consumer behavior.
“Last year, nearly one-third of specialty-automotive parts sales were made online. And 79% of specialty-automotive retailers expect online sales growth to have a significant impact on the industry over the next few years. This growth is driven by changing consumer behavior. Customers now have more outlets to research specs, compare brands and purchase products than ever before,” said Matt Kennedy of SEMA.
“As a result, many retailers are adapting to a customer base that is more informed about brands and products, more aware of price differences and may be less loyal to any retailer. Nearly two-thirds of retailers have added or grown their social-media presence to reach more customers effectively. And 59% find that providing advice and expertise offers a way to stand out in the market rather than competing on price,” he continued.
SEMA urges industry professionals to remain abreast of the unique challenges and opportunities specialty automotive retailers face daily. Its “SEMA Retail Landscape Report” is an excellent resource for such information and is available at www.sema.org/research.
Performance Racing Industry (PRI)
What’s certain, despite growing support for e-commerce, gearheads still like to get their hands dirty, and there’s no greater display of such enthusiasm than the annual Performance Racing Industry (PRI) Show.
“Amidst turmoil in the global automobile industry, automotive performance parts market is projected to exhibit a moderate CAGR of 4.5% over the forecast period (2019 – 2029). As per the findings of the latest report, the steady expansion of automotive fleet and increase in the average vehicle age will contribute significantly towards the growth of automotive performance parts market. Dramatic rise in demand for high-performance vehicles would also remain an important booster to the sales of automotive performance parts over the following years,” according to the Automotive Performance Parts Market report by Future Market Insights.
Key Takeaways – Automotive Performance Parts Market Study
- Evolving demographic trends across the globe and a shifting preference towards leisure driving are driving investments in mechanical tuning for higher engine power, torque and fuel efficiency.
- Commercial vehicle operators and fleet owners are opting for custom tuning services to improve vehicle performance and increase driving comfort. They are also looking to reduce running costs and increase operational margins through replacement of various performance parts.
- Automotive performance parts with relatively high replacement rates, such as air filters, brake pads, spark plugs and suspension bushings are significantly driving growth of the aftermarket sales channel.
- Increase in sales of mid-sized and compact passenger vehicles, particularly in Europe, make it a potential market for manufacturers specializing in the automotive aftermarket.
- An ongoing trend witnessed in the automotive industry is engine downsizing and electrification of vehicles. Use of turbochargers or superchargers is paramount in most downsizing processes, fueling the demand for power adders.
- Historically, tuning services were reserved for auto racing. Recently, they have gained significant traction in the market for passenger and commercial vehicles as well.
- In the coming years, automotive performance parts are expected to witness consistent demand via OEMs. Few models are being integrated with maintenance schedules, which continuously remind the owner of repair and maintenance services. Thus, increasing focus on scheduled and preventive maintenance of vehicles is projected to drive aftermarket growth.
Motorsports fans receive a boost in morale this month, as SEMA announced the Recognizing the Protection of Motorsports Act of 2019 (RPM Act of 2019) is making headway in Washington. The bipartisan RPM Act of 2019—led in part by U.S. Representatives Patrick McHenry (R-NC) and Raul Ruiz (D-CA)—”protects Americans’ right to convert street vehicles into dedicated racecars and the motorsports-parts industry’s ability to sell products that enable racers to compete.”
“SEMA looks forward to working with Congress to enact the RPM Act and make permanent the Clean Air Act’s original intention that race vehicle conversions are legal,” said Chris Kersting, SEMA president and CEO. “We thank Representatives McHenry and Ruiz for introducing a bipartisan bill that will protect racing and the businesses that produce, install and sell the parts that enable racers to compete.”
The RPM Act is well positioned to become law in 2020. Read the full announcement here.
Industry Events
2020 SEMA MPMC Media Trade Conference
Jan. 21–23
Santa Ana, California
Freelance journalists, bloggers and social media influencers have a chance to meet face-to-face with manufacturers of motorsports parts during the annual 2020 SEMA MPMC Media Trade Conference. “The three-day event, which media can attend at no cost by visiting www.sema.org/mtcreg, is the best place for journalists to meet with and interview manufacturers who are seeking to increase awareness and gain editorial coverage. Journalists, freelancers, bloggers and social media influencers are invited to sign up and select the companies that best meet their editorial needs. While the event is not designed for ad sales or sponsorships, media are not required to have specific assignments in order to attend. Freelancers seeking content for stories are encouraged,” says Della Domingo of SEMA. To see a list of participating exhibitors and sign up for the event, visit www.sema.org/mtcreg.
2020 Auto Summit
Feb. 14
Las Vegas, NV
View agenda