Key Performance Indicators Report – August 2019

The Briefing – Trade War
The trade war is heating up, as the U.S. government says China is manipulating its currency. Subsequently, it will involve the International Monetary Fund to eliminate unfair competition from Beijing. Reuters reports, U.S. law has three criteria for identifying manipulation among major trading partners: a material global current account surplus, a significant bilateral trade surplus with the United States and persistent one-way intervention in foreign exchange markets. This is the first time since 1994 the U.S. has accused the country of devaluing its currency to gain an unfair trade advantage.
“The sharp 1.4% drop in the yuan comes days after U.S. President Donald Trump stunned financial markets by vowing to impose 10% tariffs on the remaining $300 billion of Chinese imports from Sept. 1, abruptly breaking a brief ceasefire in a bruising trade war that has disrupted global supply chains and slowed growth,” states Reuters. China’s decision caused Asian stocks to tumble. It remains to be seen if this will push the Federal Reserve to cut U.S. interest rates further in order to ease financial conditions.
Interest Rate Decrease
In recent weeks, the Federal Reserve announced interest rate cuts for the first time in over a decade. “A preemptive move aimed at extending the already record-long economic expansion,” says Scott Horsley of NPR. The move is aimed to decrease the cost of borrowing, i.e., credit cards, auto loans and mortgages. “The outlook for the U.S. economy remains favorable and this action is designed to support that outlook,” explains Fed Chairman Jerome Powell. He went on to describe the rate cut as “an insurance policy against potential speed bumps for the economy, including rising trade tensions and a slowdown in global growth.”
Although the rate cut was largely speculated ahead of an official announcement, the stock market reacted negatively to Powell’s comments, reports NPR. “The Dow Jones Industrial Average fell more than 450 points before paring its losses to close down 334 points, or 1.2%. The S&P 500 and the Nasdaq both fell more than 1%. Investors appeared to be concerned the Fed would pause after this rate cut, although Powell left the door open to additional cuts if economic conditions warrant,” says Horseley.
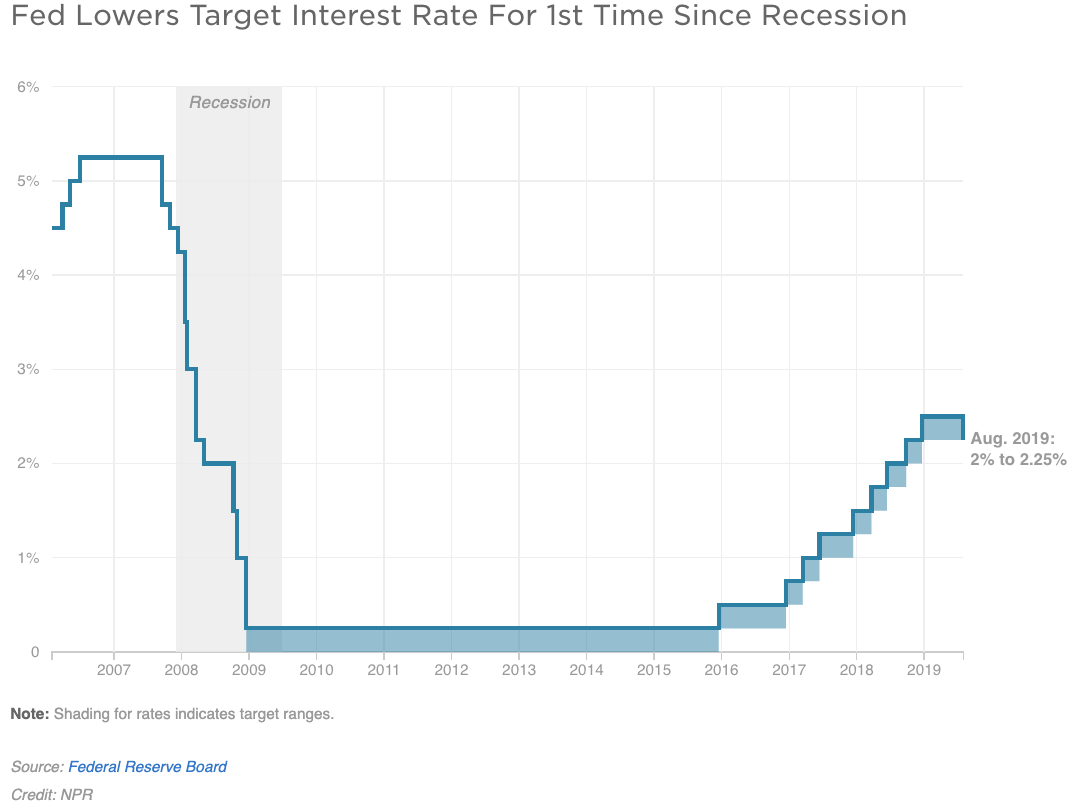
Image courtesy of NPR.
State of the Economy
Real gross domestic product (GDP) increased 2.2% in the fourth quarter of 2018. Additionally, real GDP increased at an annual rate of 3.2% during the first quarter of 2019, as a result of positive contributions from personal consumption expenditures (PCE), private inventory investment, exports, state and local government spending, as well as non-residential fixed investment, according to the U.S. Bureau of Economic Analysis.
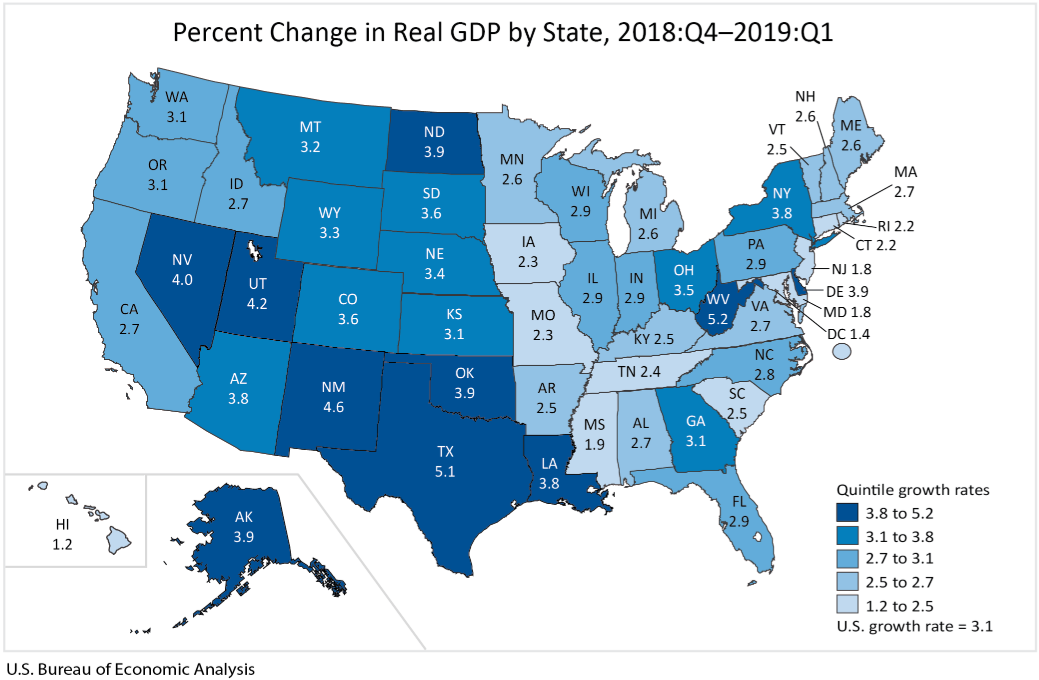
Graphic courtesy of the U.S. Bureau of Economic Analysis
Additionally, second quarter GDP increased at an annual rate of 2.1%, with July marking the largest economic expansion in U.S. history. Below are some interesting facts delivered by the U.S. Bureau of Labor Statistics:
- From September 2018 to December 2018, gross job gains from opening and expanding private-sector establishments were 7.7 million, an increase of 281,000 jobs from the previous quarter. During this period, gross job losses from closing and contracting private-sector establishments were 6.9 million, a decrease of 506,000 jobs from the previous quarter. The difference between the number of gross job gains and the number of gross job losses yielded a net employment gain of 814,000 jobs in the private sector during the fourth quarter of 2018
- Approximately 164,000 jobs were added, bringing the total to more than 5.7 million jobs since January 2017
- The unemployment rate was unchanged at 3.7 %.
- Among the major worker groups, the unemployment rate for Asians increased to 2.8% in July. The jobless rates for adult men (3.4%), adult women (3.4%), teenagers (12.8%), Whites (3.3%), Blacks (6%) and Hispanics (4.5%) showed little or no change over the month
- Notable job gains occurred in professional and technical services (+31,000), health care (+30,000), social assistance (+20,000) and financial activities (+18,000). Manufacturing employment changed little in July (+16,000) and thus far in 2019
- In July, average hourly earnings for all employees on private nonfarm payrolls rose by eight cents to $27.98, following an eight-cent gain in June. Wages grew by 3.2% year-over-year, marking a full year that wage growth has been at or above 3%. Additionally, compensation costs for service occupations increased 3.7% from June 2018 to June 2019
- Consumer spending reached a 4.3% annual rate, while spending on goods rose at the fastest rate since the first quarter of 2006, according to a recent statement by the Office of Public Affairs
Graphic courtesy of the U.S. Bureau of Labor Statistics
Despite trade tensions, “The Trump economy is growing strong and, on the heels of 3.1% growth in the first quarter, is poised to continue expanding,” said Secretary of Commerce Wilbur Ross. “President Trump’s ambitious agenda of deregulation, tax reform and job creation is making the U.S. the premier place for business, and is restoring our position as an economic leader on the world stage.”
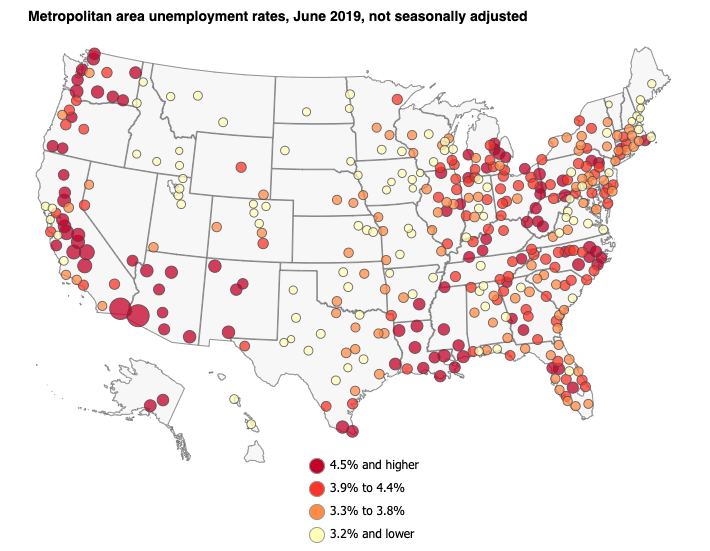
Metropolitan Area Employment and Unemployment Summary
Unemployment rates were lower in June than a year earlier in 294 of the 389 metropolitan areas, higher in 67 areas and unchanged in 28 areas, according to the U.S. Bureau of Labor Statistics. A total of 48 areas had jobless rates of less than 3% and two areas had rates of at least 10%. Nonfarm payroll employment increased over the year in 47 metropolitan areas, decreased in one area and was essentially unchanged in 341 areas. Other noteworthy data from the U.S. Bureau of Labor Statistics:
- During this timeframe, Burlington-South Burlington, Vermont reported the lowest unemployment rate at 1.9%, followed by Idaho Falls, Idaho; Midland, Texas; and Portsmouth, New Hampsire/Maine at 2.1% each. Yuma, Arizona and El Centro, California had the highest unemployment rates, 19.6% and 18.6% respectively
- A total of 192 areas had June jobless rates above the U.S. rate of 3.8%, 183 areas had rates below it and 14 areas had rates equal to that of the nation
- Vineland-Bridgeton, New Jersey, had the largest year-over-year unemployment rate decrease in June (-2.2%). Twenty-nine other areas had rate declines of at least 1%. The largest year-over-year rate increase occurred in Yakima, Washington (+1.2%)
- Of the 51 metropolitan areas with a 2010 Census population of 1 million or more, Austin-Round Rock, Texas, San Francisco-Oakland-Hayward, California and San Jose-Sunnyvale-Santa Clara, California had the lowest unemployment rates in June at 2.7% each. Conversely, New Orleans-Metairie, Louisiana reported the highest jobless rate among the large areas at 5%. The largest rate declines occurred in Birmingham-Hoover, Alabama and Cleveland-Elyria, Ohio (-1.1%). The largest jobless rate increase was in Minneapolis-St. Paul-Bloomington
Graphic courtesy of the U.S. Bureau of Labor Statistics
Graphic courtesy of the U.S. Bureau of Labor Statistics
Automotive Aftermarket KPI
In a recent SEMA eNews, Douglas McColloch provided industry professionals with an update about the health of the car care market, which the 2018 SEMA Market Report estimates to be $1.76 billion in annual sales. Notably, these products can be purchased seemingly anywhere, from large retail chains like Pep Boys to online marketplaces like Amazon.
“Two-thirds of car-care product purchases are made at traditional brick-and-mortar outlets,” McColloch said.
McColloch compiled valuable insights and keen observations about the state of the market from major players across the industry.
“Nearly all of our experts agreed that the marketplace is experiencing technology-driven changes that are occurring at breakneck speed,” he said. Click to review McColloch’s full coverage. A snapshot of feature participant input is included below:
- “The car-care industry is currently experiencing the greatest explosion in technology that we’ve ever seen,” said Mike Stoops, senior global product and training specialist for Meguiar’s. “Everything, from dual-action tool technology to compounds, pads and paint protection is evolving at a very hectic pace.”
- Michael Starzman, director of global field quality at WD-40 Co., adds, “Technology is advancing the things that were just dreams less than 10 years ago and are now available to the general consumer.”
- Tunch Goren, founder and CEO of 3D International, has seen increased interest in sandpaper products. “The product is much more refined and preps the surface in a much better way, so when you compound and polish the surface, you don’t have to work as hard.”
- “Full vehicle wraps are increasing as people continue to learn about the value of paint-protection film,” said Katie Johnson, global marketing manager at 3M Automotive. “Matte-finish paint-protection film (PPF) has also been increasing in popularity. Ceramic coatings on top of PPF as an additional layer of paint protection is also a service that has increased awareness and interest.”
Kyle Martin, project manager at Adam’s Polishes, said, “Waxes and sealants are slowly becoming obsolete.”
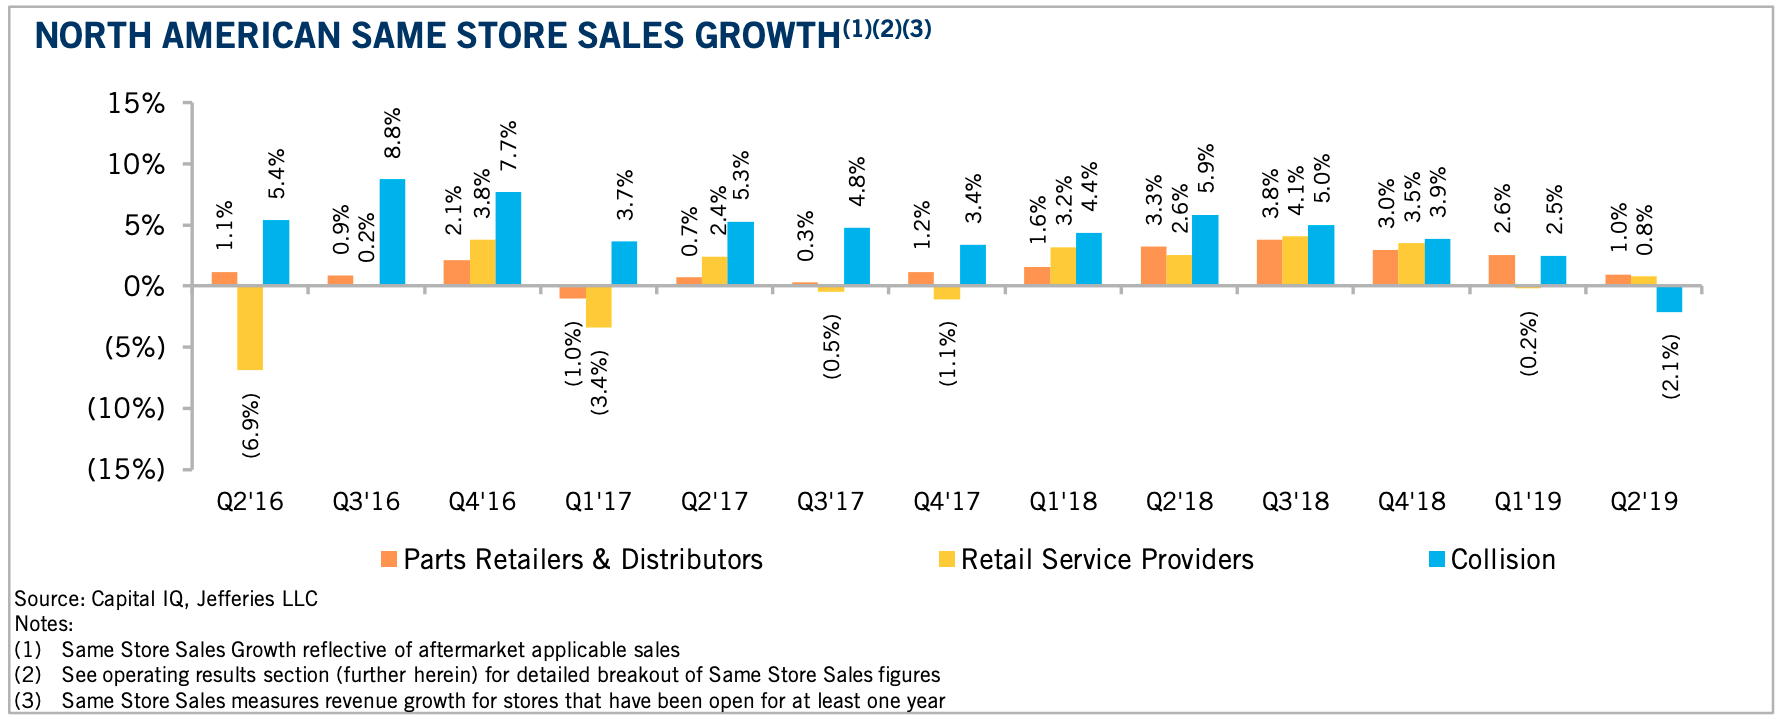
Graphic courtesy Jefferies Automotive Aftermarket Group
In-Vehicle Premium Audio
Strategy Analytics reports an uptick in consumer interest and willingness to pay for in-vehicle premium audio, as it applies to those surveyed across the U.S., Western Europe and China. Consumers in Western markets were also asked about their perception of 16 different premium audio brands. The consensus is that premium in-car audio remains valuable for consumers overall and Bose is the preferred audio brand in all markets-though at least five other brands are viable competitors.
The takeaway: changing media consumption habits in the car could spell opportunity for savvy stakeholders. Review the report here.
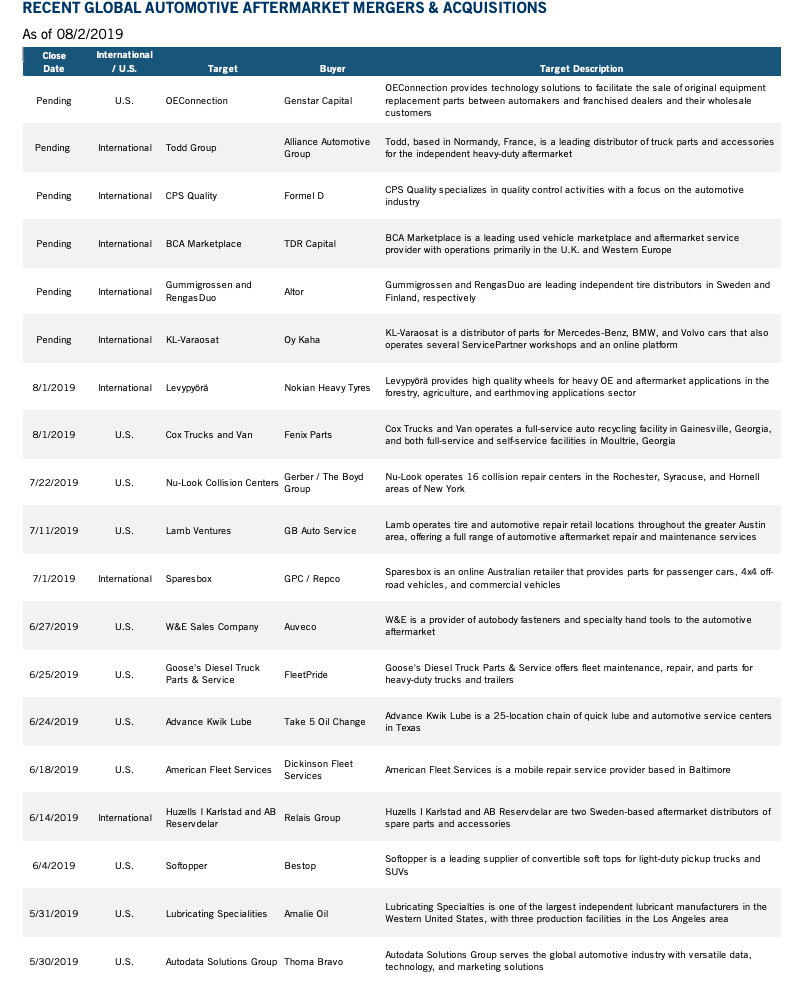
Table courtesy Jefferies Automotive Aftermarket Group
Comprehensive Overview – New, Used, Leased Vehicle Statistics
Thus far, 2019 has been a year riddled with contrasts. As automakers struggle to find a new normal amid rising interest rates, waning demand, substantial growth in the used market and uncertain government policies, according to Edmunds.
Jeremy Acevedo, Edmunds’ manager of industry analysis, says the automotive industry is fighting a war on multiple fronts.
“Old cars are piling up on dealer lots, a glut of affordable off-lease vehicles is luring shoppers into the used market and, even with the Fed anticipated to lower rates in July, higher interest rates are here to stay,” Acevedo said. “Strong economic indicators such as consumer confidence and low unemployment are keeping sales at historically elevated levels, but automakers have also been relying a little too heavily on fleet sales to keep these numbers up as well, which isn’t a sustainable model.”
Analysts evaluate these issues and the major factors influencing the new vehicle market in the Midyear Update of the Edmunds 2019 Automotive Trends Report, but such trends are apparent in the collective data below as well.
New Vehicle Sales
Overall vehicle sales are down 2.2% during the first half of 2019, which is equivalent to nearly 200,000 units.
“With the highest average incentive in 19 months, retail sales of new vehicles were up 1.4% in July, leading to a retail SAAR of 14.7 million, down from 14.9 million last July but the strongest retail SAAR since December,” Manheim reported.
The Cinderella story is fleet, with both the commercial and rental categories serving as a driving force behind total new vehicle sales. The commercial fleet channel is up 30% year-over-year during July and is predicted to remain strong through 2019.
“Fleet sales are up 6% in 2019 through July, and retail sales are down 3% as the overall new vehicle market is down 2% this year,” according to Manheim.
The Cox Automotive Forecast includes a few important takeaways as well:
- New light-vehicle sales, including fleet, are forecast to reach 1.38 million units, up 0.5% from July 2018. However, versus June 2019’s strong performance, sales are expected to fall more than 9%, or more than 140,000 vehicles
- The SAAR in July 2019 is estimated to be 16.6 million, down from last month’s surprisingly strong 17.3 million level and down slightly from last year’s 16.7-million pace. This July has 25 selling days, one more than last July, which is contributing to the relatively weak SAAR estimate given an increase in sales volume.
- Record volume for July occurred in 2005 when sales reached 1.8 million vehicles and a SAAR of 20.6 million. The record occurred during the summer of no haggle incentive programs when employee pricing for all buyers was widespread. Even with the volume of unique incentive programs running high all year, it is unlikely that new records will be reached this month
- Despite uncertainty in the new vehicle market, full-size diesel trucks continue to perform well. New data from the Diesel Technology Forum indicates that diesel truck sales are up 23% during the first quarter of 2019. For perspective, that is more than double the figure for all cars and trucks in the same quarter (11%).
“Trucks were the big story in July as new mid-size and full-size offerings helped to drive truck prices up about 3%, while contributing to sales growth in this down market. With the new 1500 trucks from RAM and GM that came out last year, full-size truck prices have now eclipsed the $50,000 mark, and new heavy-duty trucks from these manufacturers this year will push those numbers up even more,” said Tim Fleming, analyst for Kelley Blue Book.
Strong consumer confidence and employment gains are supporting stable demand for light vehicles.
“However, affordability issues continue to weigh on the market. The estimated average transaction price for a new light vehicle in the U.S. is $37,285 in the most recent Kelley Blue Book report, and we do not see this number coming down,” said Charlie Chesbrough, senior economist for Cox Automotive.
New-vehicle prices increased $1,246 (+3.5%) from July 2018, while decreasing $312 (-0.8%) from last month. Current data and takeaways from Kelley Blue Book:
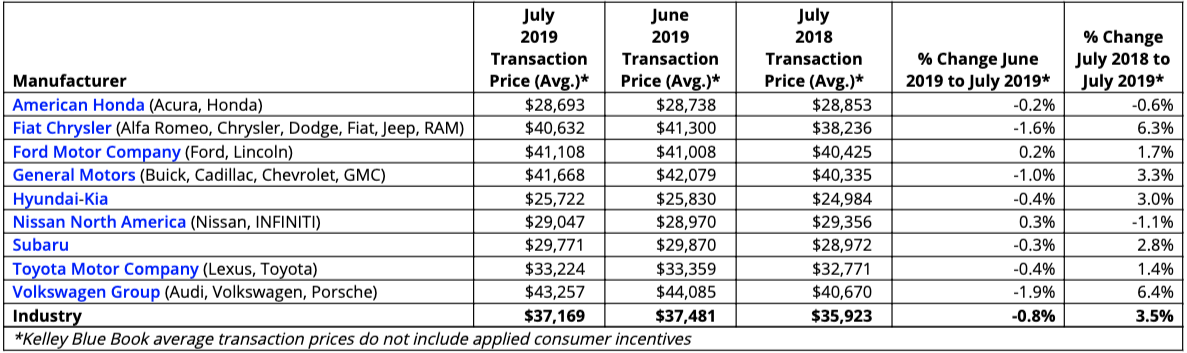
Table courtesy of Kelley Blue Book
- American Honda was down slightly in July, as Acura prices fell 2% while Honda stayed flat. Most Acura models declined during the month, while Honda was brought down by the Accord sedan, which fell 1%. The refreshed HR-V had a good month as it climbed 4%
- General Motors was up 3% for the month, as the Chevrolet brand saw the biggest gain at 4%. Chevrolet was helped by a very strong mix of trucks and SUVs, which should amount to more than an 80% sales mix in July. GMC also saw a slight increase in July, largely due to the Sierra and its 3% gain
- Volkswagen Group’s transaction prices rose by 6%, with Audi up an impressive 13% from last year. Audi was buoyed by its redesigned A6 and A8 sedans, as well as the recently debuted Q8 and e-tron SUVs. The Volkswagen brand climbed 2%, helped by the Tiguan (+5%) and the Jetta (+3%), as well as a sales mix more geared toward SUVs
Click here to view important recall information.
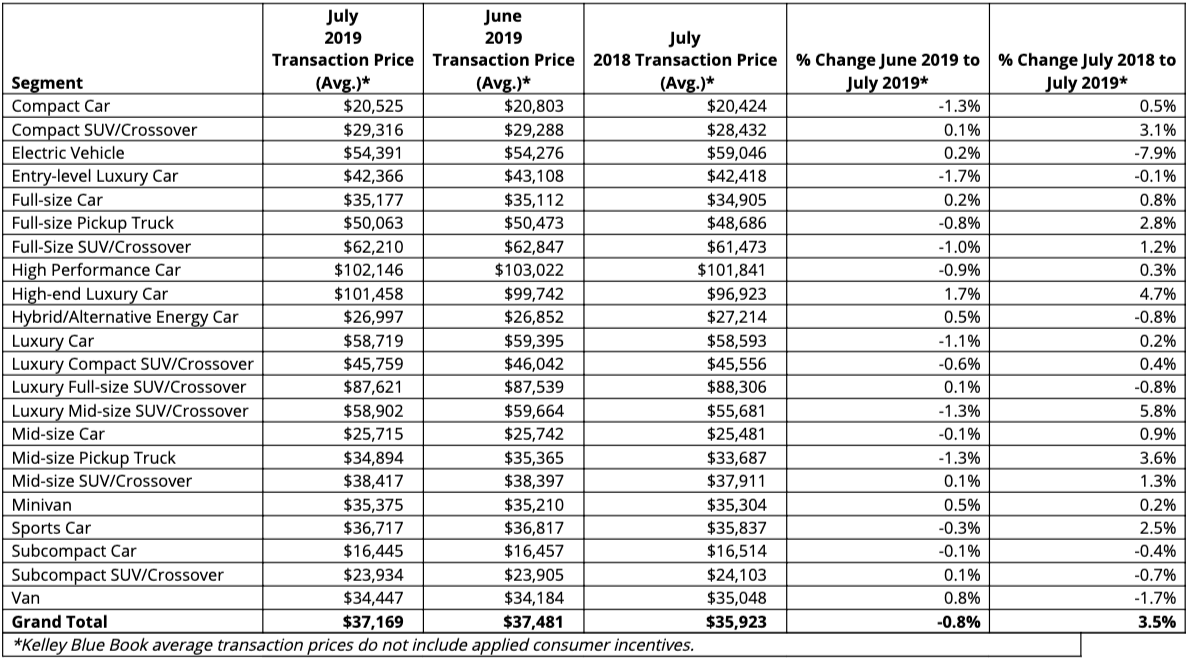
Table courtesy of Kelley Blue Book
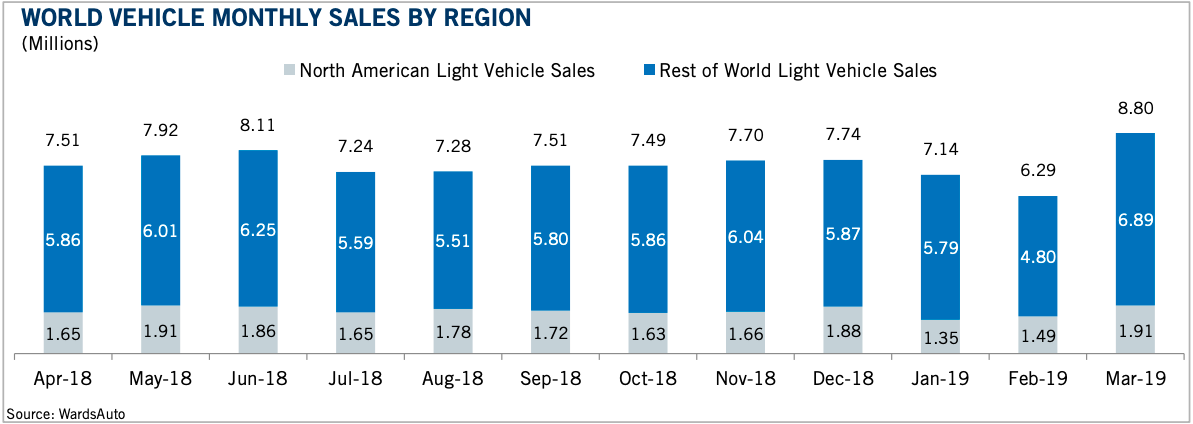
Table courtesy Jefferies Automotive Aftermarket Group
Manheim Used Vehicle Index
Wholesale used-vehicle prices (on a mix-, mileage- and seasonally adjusted basis) increased 0.01% month-over-month in July. This brought the Manheim Used Vehicle Value Index to 140.5, a 2.6% increase from a year ago.
Manheim reports that after steady to slightly higher prices during June in weekly Manheim Market Report (MMR) prices, July prices were firm.
“Three-year-old vehicle values in aggregate were flat for the month, which is much stronger than a typical July, when prices normally decline by about 1%. As a result of the stable month, prices in aggregate remain slightly lower than the beginning of the year, but non-luxury prices remain higher. Last July saw price appreciation, so even with stable prices, the comparison to last year is particularly tough,” according to Manheim.
According to Cox Automotive estimates, “Total used vehicle sales volume was down 0.3% year-over-year in July. We estimate the July used SAAR to be 39.7 million, down from 40.1 million last July and down slightly from June’s 39.8 million rate. The July used retail SAAR estimate is 20.1 million, up from 19.8 million last July and up from June’s 19.8 million rate.”
Click for more leased car data.
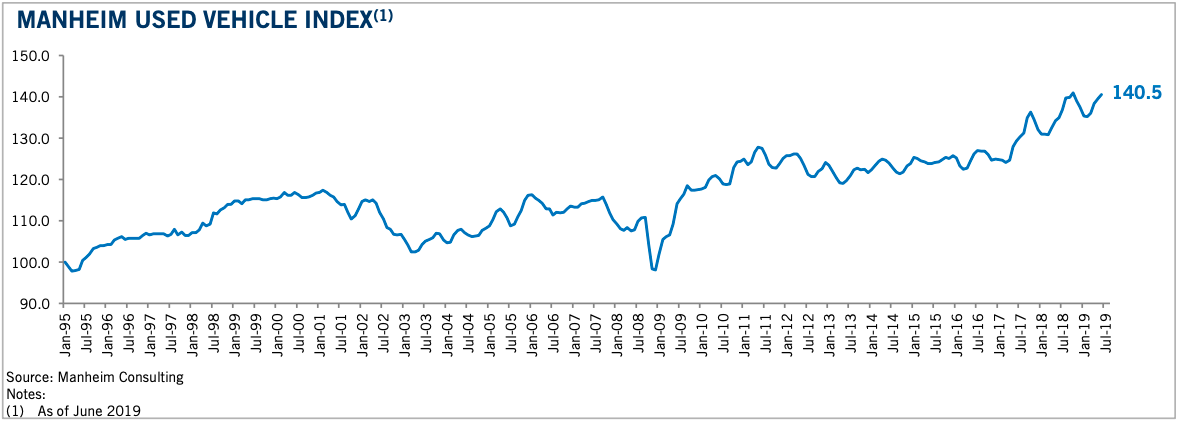
Table courtesy Jefferies Automotive Aftermarket Group
America’s Car Debt by State
According to HowMuch.net, this data is presented on behalf of the Federal Reserve’s New York branch, which compiles quarterly reports about household debt and credit for all 50 states. Below are the most recent figures regarding auto debt balance per capita as of Q4 2018. More importantly, what do such numbers mean for the automotive industry?
The Top 5 Auto Debt Balances Per Capita by State
1. Texas: $6,700
2. Louisiana: $5,700
3. Georgia: $5,400
4. New Mexico: $5,400
5. Arkansas: $5,300
The Lowest 5 Auto Debt Balances Per Capita by State
1. District of Columbia: $3,000
2. Connecticut: $3,600
3. New York: $3,700
4. Rhode Island: $3,700
5. Michigan: $3,700
At an average debt load per state of over $4,500, the nationwide auto debt load increased by more than $9 billion in Q4 2018 to $1.3 trillion. This number, boosted by historically strong levels of new loans, also comes with a boost in serious delinquency rates to 2.4%.
Four of the five states with the highest per capita auto debt loads are in Southern states, and four of the five states with the lowest loads are in Northeastern states (including the District of Columbia in first place). Michigan, not known for its economic robustness, has the fifth-lowest auto debt load. Of course, the cost of the car loan alone is not the only driving expense. There are also factors like parking, fuel and insurance rates.
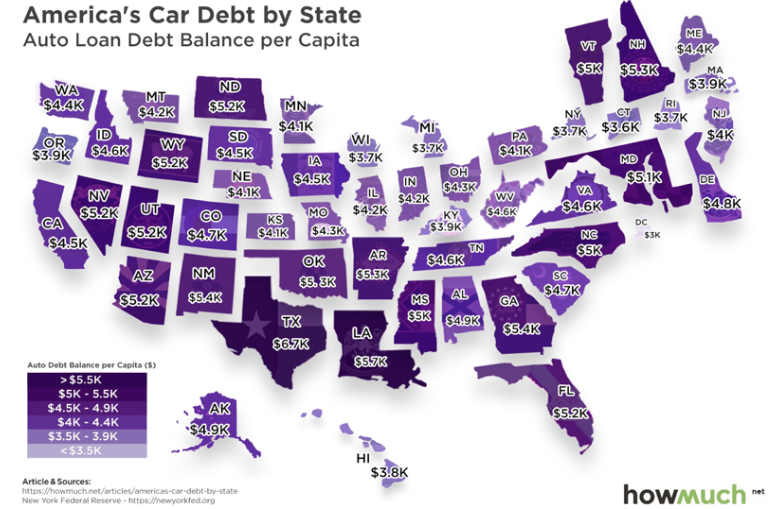
HowMuch.net showscases the average auto debt balance per capita for all 50 states in this graphic-a darker shade of purple indicates a higher debt load.
While a large-scale default crisis in the auto market has not occurred yet, high debt levels have contributed to an already shaky automotive industry. Auto sales were down in the first half of 2019, driven by higher interest rates and larger fleets of used vehicles. General Motors CEO Mary Barra, sensing industry shifts, said in a meeting with leaders of the United Auto Workers that “our collective future is at stake.”
This near auto loan crisis is further perpetuated by, among other things, rising vehicle transaction prices and a lending community that inflates consumer confidence during financing, via low-to-no down payments and extended terms-some of which have eclipsed six years.
Personal finance website ValuePenguin by Lending Tree reported that the national average for U.S. auto loan interest rates is 4.21% on 60 -month loans, calculated on a median FICO credit score of 706 for American auto loan consumers.
While interest rates have remained steady since their record lows in 2013, term lengths have added a full four months, coming in at an average 69.5 months. Additionally, average new vehicle prices have risen to record highs, up roughly $6,000 since 2013, according to data from TrueCar.com.
Perhaps most importantly however, is that no consumer’s financial situation is ever truly average. Unless each shopper is receiving unbiased, detailed financial support tailored specifically to his or her needs during the car-buying process, it’s impossible to ensure that they aren’t entering new vehicle ownership under terms that will simply exacerbate existing debt.
Really, the conversation should be more comprehensive than the current auto loan situation. True: the economy remains strong with job growth and a low unemployment rate. And, yes, IHS Markit reports that people are holding onto their vehicles for much longer than ever before, which makes those long-term payments easier for a consumer to justify. However, many Americans find themselves straddled with other large sums of household debt and monthly expenditures like a mortgage, student loans and credit cards, or daycare, food and health care, on top of the monthly car loan, gas, insurance, maintenance and even parking costs associated with vehicle ownership. The signs are hinting a tipping point is ahead.
DID YOU KNOW?
- Auto loan balances in the U.S. hit a record high $1.28 trillion in Q1 2018
- The average state-wide auto debt load per capita hit $4,700, a 67% increase over the last six years
- The flow into serious delinquency is up to 2.4% , up from 1.5% in 2012
RV Industry and Outdoor Recreation
Unit sales continue to suffer across the RV industry. A total of 36,524 wholesale shipments were made during June. That is a year-over-year decrease of 10.3%, according to the RV Industry Association’s June survey of manufacturers.
Furthermore, as RV PRO reported, “Towable RVs, led by conventional travel trailers, totaled 33,171 units for the month, a decrease of 9.2% compared to last June’s total of 36,532 units. Motorhomes finished the month with 3,353 units, down 20.3% compared to the June 2018 total of 4,206 units. Through June, RV shipments have reached 216,581 units, down 20.3% from the 271,588 units at this point last year. Park model RVs finished the month up 30.1% compared to last June with 389 shipments to retailers.”
Outdoor Recreation Legislation
Though the RV market continues to face challenges, representatives across multiple industries are working together to ensure a bright future in outdoor recreation.
The U.S. House Natural Resources Committee passed SEMA-supported legislation that would dedicate much-needed funding to address the more than $16 billion maintenance backlog on America’s public lands, according to SEMA.
The “Restore Our Parks and Public Lands Act” would create a national park service and public lands fund for Fiscal Years 2020 through 2024, using unallocated revenue from energy produced on federal government-owned lands and waters. The amount of money that could be allocated to the fund would be capped at $1.3 billion annually during the five-year program, according to SEMA.
The deferred maintenance backlog has received considerable attention recently, as Vice President Pence and U.S. Department of Interior Secretary David Bernhardt recently traveled to Yellowstone National Park to discuss the matter, according to SEMA. The Senate Energy and Natural Resources Committee held a hearing last week on a bill to address the maintenance backlog on National Park Service lands.
Consumer Confidence
Among other variables, steady job growth and a low unemployment rate have contributed to a 9.2% jump in consumer confidence during July, the highest reading of the year. As reported by the Conference Board Consumer Confidence Index, the Index now stands at 135.7 (1985=100)-up from 124.3 in June.
The Present Situation Index, which is based on consumers’ assessment of current business and labor market conditions, increased from 164.3 to 170.9. The Expectations Index, taking into account consumers’ short-term outlook for income, business and labor market conditions, increased from 97.6 last month to 112.2 this month.
“After a sharp decline in June, driven by an escalation in trade and tariff tensions, Consumer Confidence rebounded in July to its highest level this year,” said Lynn Franco, senior director of economic indicators at The Conference Board. “Consumers are once again optimistic about current and prospective business and labor market conditions. In addition, their expectations regarding their financial outlook also improved. These high levels of confidence should continue to support robust spending in the near-term despite slower growth in GDP.”
Notable highlights from this month’s report are included below:
- Consumers’ assessment of present-day conditions improved during July. Those claiming business conditions are good increased from 37.5% to 40.1%, but those saying business conditions are bad also increased slightly, from 10.6% to 11.2%
- Consumers’ appraisal of the job market was also more favorable. Those saying jobs are plentiful increased from 44% to 46.2%, while those claiming jobs are hard to get declined from 15.8% to 12.8 %
- Consumers were more optimistic about the short-term outlook in July. The percentage of consumers expecting business conditions will be better six months from now increased from 19.1% to 24%, while those expecting business conditions will worsen declined from 12.6% to 8.7%
- Consumers’ outlook for the labor market was also more upbeat. The proportion expecting more jobs in the months ahead increased from 17.5%to 20.5%, while those anticipating fewer jobs decreased from 13.9% to 11.5%. Regarding their short-term income prospects, the percentage of consumers expecting an improvement increased from 20.5% to 24.7%, while the proportion expecting a decrease declined from 7.5% to 6.3%
Despite an uptick in consumer confidence, “It will likely take a hit in August with escalating trade tensions with China and associated volatility in equity markets,” according to Cox Automotive.
Housing Starts
The U.S. Census Bureau and the U.S. Department of Housing and Urban Development announced the new residential construction statistics for June 2019. To review additional report details, click here.
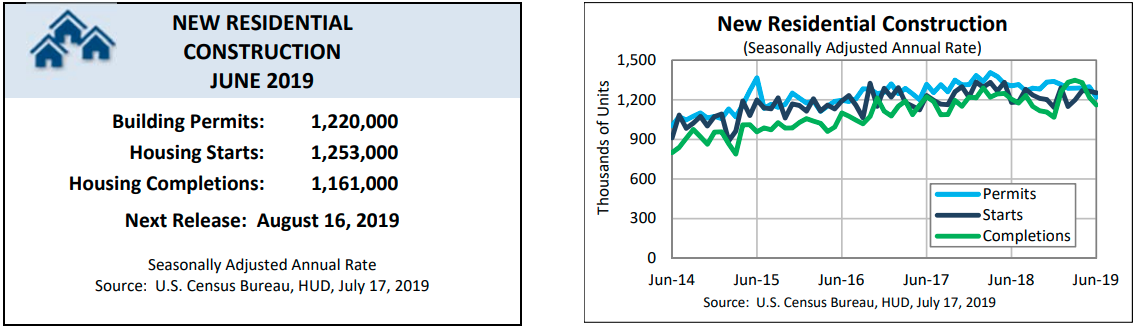
Graphics courtesy of the U.S. Census Bureau
Small Business Index
Small business job creation slowed in July, according to the National Federation of Independent Business (NFIB). Small business job creation fell to an average addition of 0.12 workers per firm, which is down from June-but an historically strong number nonetheless. A record 26% of small business owners surveyed cited their most important business problem as difficulty finding qualified workers.
“While small business owners are continuing to hire employees and create new jobs at historic levels this summer, finding qualified workers is clearly restricting growth that could otherwise be taking place,” said NFIB President and CEO Juanita D. Duggan. “Owners continue to benefit from tax and regulatory relief they’ve received to help recruit and retain employees.”
“The inability to assemble work teams is a major contributor to the lackluster performance in labor intensive industries, most notably in construction,” added NFIB Chief Economist Bill Dunkelberg. “Finding qualified workers has been a continuing problem for small businesses, and it is affecting productivity.”
Other key takeaways from the report include:
- A seasonally adjusted net 21% of small business owners plan to create new jobs, up two points from June
- Not seasonally adjusted, 23% plan to increase total employment at their firm and 5% plan reductions
- The shortage of qualified labor continues to hinder owners’ ability to fill open positions. Sixty-three percent of owners reported hiring or trying to hire, up 5% from the month before. However, 89% of those owners reported few or no qualified applicants for their open positions
- Thirty-nine percent of owners reported job openings they could not fill in the current period, up three points from June
- Thirty-five percent have openings for skilled workers (up 4%) and 15% have openings for unskilled labor (up 1%)
- Thirty-six percent of owners reported few qualified applicants for their open positions, and 20%reported none
- Thirty-two percent of owners in construction plan to add jobs, compared with 5% who plan reductions. However, 57% report few or no qualified applicants; 42% cite the labor shortage as their top business problem
- In transportation, 61% plan to increase employment, while 4% plan reductions
- Overall, few owners say they are cutting jobs, indicating that initial claims for unemployment will remain historically low
Up 4% from June, 32% of owners reported raising worker compensation. The frequency of plans to raise compensation fell to 17%, the lowest reading since 2017. Dunkelberg says raising compensation to keep or attract workers is the only short-term response that firms can make to rectify the labor shortage.
Consumer Price Index
The Consumer Price Index for all urban consumers (CPI-U) saw an uptick of 0.3% during July on a seasonally adjusted basis after rising 0.1% in June, states the U.S. Bureau of Labor Statistics. Additionally, over the last 12 months, the all-items index increased 1.8% before seasonal adjustment.
“Increases in the indexes for gasoline and shelter were the major factors in the seasonally adjusted all items monthly increase. The energy index rose in July as the gasoline and electricity indexes increased, though the natural gas index declined. The index for food was unchanged for the second month in a row, as a decline in the food at home index was offset by an increase in the food away from home index,” according to the report. “The July rise was broad-based, with increases in the indexes for shelter, medical care, airline fares, household furnishings and operations, apparel, and personal care all contributing to the increase. The index for new vehicles was one of the few to decline in July.”
Furthermore, the all items index increased 1.8% for the 12 months ending July, which is a larger increase than the 1.6% rise for the period ending June. According to the U.S. Bureau of Labor Statistics, the index for all items less food and energy rose 2.2% during the same period. That is slightly more than the 2.1% increase for the period ending June. Also, the food index rose 1.8% over the last year, but the energy index declined 2%.
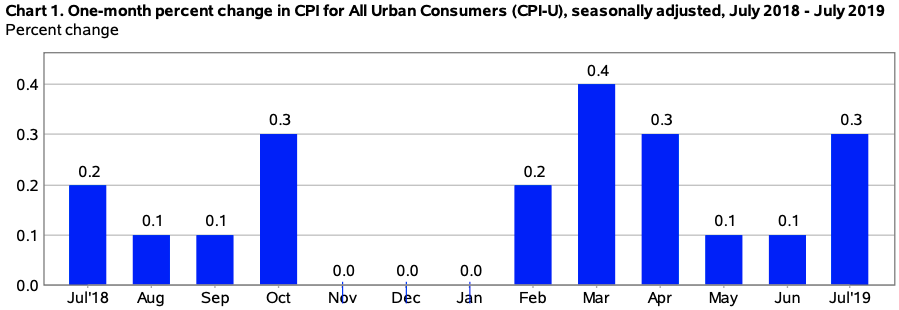
Graphic courtesy of the U.S. Bureau of Labor Statistics
Manufacturing ISM
Economic activity in the manufacturing sector expanded in July and the overall economy grew for the 123rd consecutive month, according to the nation’s supply executives in the latest Manufacturing ISM Report On Business. The July PMI registered 51.2%, a decrease of 0.5 percentage point from the June reading of 51.7%.
The Report On Business measures its data using the Purchasing Manager’s Index (PMI), which is an indicator of economic health in the manufacturing sector. A reading above 50% indicates that the manufacturing economy is generally expanding, while below 50% indicates that it is generally contracting.
“Comments from the panel reflect continued expanding business strength, but at soft levels. July was the fourth straight month of slowing PMI expansion.” said Timothy R. Fiore, chair of the Institute for Supply Management (ISM) Manufacturing Business Survey Committee. “Demand expansion resumed, with the New Orders Index recording marginal growth, the Customers’ Inventories Index entering ‘about right’ territory, and the Backlog of Orders Index contracting for the third straight month, at stronger levels compared to prior months.
“New export orders also contracted. Consumption (measured by the Production and Employment indexes) continued to expand, but at lower levels. This resulted in a combined decrease of 6.1 percentage points to the PMI calculation due to minimal new-order growth, backlog contraction and customer-inventory gains.
“Inputs-expressed as supplier deliveries, inventories and imports-were lower this month, due to inventory tightening for the second straight month and continued slower supplier deliveries, resulting in a combined 3-percentage point improvement in the Supplier Deliveries and Inventories indexes. Imports and new export orders contracted.
“Overall, inputs indicate supply chains are responding marginally slower and supply managers are closely matching inventories to new orders. Prices contracted for the second consecutive month, indicating lower overall systemic demand.”
“Respondents expressed less concern about U.S.-China trade turbulence, but trade remains a significant issue,” Fiore concluded. “More respondents noted supply chain adjustments as a result of moving manufacturing from China. Overall, sentiment this month is evenly mixed.”
Of the 18 manufacturing industries, nine reported growth in July, in the following order: Wood Products; Printing & Related Support Activities; Furniture & Related Products; Food, Beverage & Tobacco Products; Plastics & Rubber Products; Computer & Electronic Products; Textile Mills; Petroleum & Coal Products; and Chemical Products.
The nine industries reporting contraction in July-in the following order-are: Apparel, Leather & Allied Products; Fabricated Metal Products; Primary Metals; Nonmetallic Mineral Products; Transportation Equipment; Paper Products; Miscellaneous Manufacturing; Electrical Equipment, Appliances & Components; and Machinery.
- Commodities Up in Price: Corn (2); and Steel Products* (3)
- Commodities Down in Price: Aluminum (4); Aluminum Products; Copper (2); Corrugated Boxes (2); Electrical Components; Polypropylene; Steel; Steel – Hot Rolled (4); Steel – Scrap; Steel – Stainless (2); and Steel Products* (7)
- Commodities in Short Supply: Electrical Components (2); and Helium
*The number of consecutive months the commodity is listed is indicated after each item. *Indicates both up and down in price.
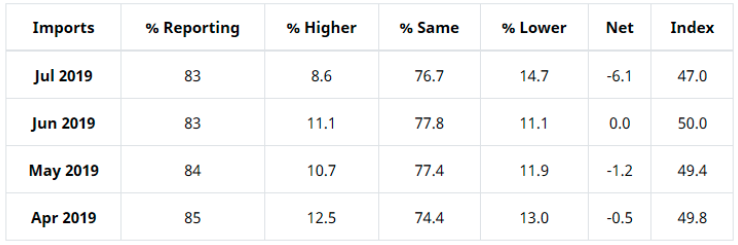
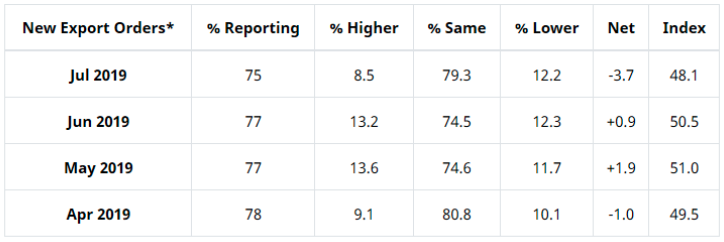
Import and Exports
ISM’s New Export Orders Index registered 48.1% in July, 2.4% lower compared to the June reading of 50.5%, indicating that new export orders contracted following one month of growth.
Many respondents noted global trade softness in China as a reason for sluggish activity. Two of the six big industry sectors expanded, while three reported contraction, according to Fiore.
The three industries reporting growth in new export orders in July include Miscellaneous Manufacturing; Food, Beverage & Tobacco Products; and Chemical Products. The seven industries reporting a decrease in new export orders in July are: Apparel, Leather & Allied Products; Fabricated Metal Products; Primary Metals; Paper Products; Plastics & Rubber Products; Transportation Equipment; and Computer & Electronic Products. Eight industries reported no change in new export orders in July as compared to June.
ISM’s Imports Index registered 47% in July, a decrease of 3% when compared to the 50% reported for June, indicating that imports contracted in July after being unchanged in June.
“Three of the six big industry sectors contributed to the contraction. The Imports Index reached its lowest level since August 2016, when it registered 46.8%,” Fiore said.
The only industry reporting growth in imports during the month of July is Wood Products. The 11 industries reporting a decrease in imports in July are Apparel, Leather & Allied Products; Paper Products; Electrical Equipment, Appliances & Components; Furniture & Related Products; Primary Metals; Nonmetallic Mineral Products; Fabricated Metal Products; Machinery; Computer & Electronic Products; Plastics & Rubber Products; and Transportation Equipment.
Six industries reported no change in raw materials imports in July as compared to June.