Key Performance Indicators Report – July 2019

Briefing
As the first half of 2019 comes to a close, the United States enters the longest economic expansion during its history, according to Kyle Cheng on behalf of SEMA.
“The economy is intact, and the risk of recession has diminished. Further risks of additional tariffs appear low for now but tension remains, and growth is slowing both at home and abroad,” Cheng said.
Although, the U.S. did impose additional tariffs on Mexican steel, as the U.S. Commerce Department confirmed following an investigation that concluded Mexico and China-but not Canada-were aiding manufacturers of fabricated structural steel with government subsidies.
Cheng pointed to the stability of consumer spending at a healthy level, and a tight labor market that is keeping pressure on wages.
“Consumers are feeling optimistic, and that confidence is driving many to look for new opportunities. Good fundamentals should carry the economy the rest of the year,” he said. This includes a manufacturing sector that added an impressive 17,000 new jobs last month-a strong increase from the prior three months.
“Fewer trade uncertainties, a weaker dollar and improving business sentiment could collectively help manufacturers in the second half of the year,” Cheng added.
State of the Economy
The U.S. Bureau of Labor Statistics released its recent employment analysis, with Labor Secretary Alexander Acosta commenting that the total nonfarm payroll employment and the general unemployment remains relatively unchanged at 3.7 percent.
“The June jobs report surpassed expectations-adding 224,000 jobs to the economy, totaling 5.6 million jobs created since January 2017. The unemployment rate ticked up to 3.7 percent in June, as 335,000 individuals entered the labor force exceeding the population growth by 158,000.”
The unemployment rate has remained at or below 4 percent for 16 consecutive months.
Current unemployment rates for major workers remain little changed as well, with data confirming adult men, adult women and Whites at 3.3 percent, teenagers at 12.7 percent, Blacks at 6 percent, Hispanics at 4.3 percent and Asians at 2.1 percent-a new record low.
At 1.5 percent each, Ames, Iowa, and Burlington-South Burlington, Vermont had the lowest unemployment rates among the 389 metropolitan areas during May 2019. Those rates were followed by Midland, Texas at 1.7 percent; Iowa City, Iowa at 1.8 percent; and Dubuque, Iowa at 1.9 percent.
Yuma, Arizona and El Centro, California-17.1 and 16.4 percent respectively-had the highest unemployment rates. Furthermore, The Bureau of Labor Statistics reports from May 2018 to May 2019, nonfarm employment actually rose in 29 of the 51 metropolitan areas with a 2010 Census population of 1 million or more, while employment was essentially unchanged in 22 areas. The largest over-the-year percentage increases in employment in these large metropolitan areas occurred in Phoenix-Mesa-Scottsdale, Arizona (+3.2 percent), Orlando-Kissimmee-Sanford, Florida (+3.1 percent), as well as Dallas-Fort Worth-Arlington, Texas and Las Vegas-Henderson-Paradise, Nevada (+2.9 percent each).
On the last business day of May 2019, the number of job openings was 7.3 million, representing an increase of 197,000 since May 2018. The job openings rate-the number of job openings as a percentage of total employment plus the total number of job openings-was 4.6 percent in May 2019, the same as it was a year earlier.
Additionally, job gains were reported in professional and business services-which added 51,000 jobs in June-health care, transportation and warehousing.
Other Important highlights from the U.S. Bureau of Labor Statistics include:
- Employment in health care increased by 35,000 over the month and by 403,000 over the past 12 months. In June, job growth occurred in ambulatory health care services (+19,000) and hospitals (+11,000)
- Transportation and warehousing added 24,000 jobs over the month and 158,000 over the past 12 months. In June, job gains occurred among couriers and messengers (+7,000) and in air transportation (+3,000)
- Construction employment continued to trend up in June (+21,000), in line with its average monthly gain over the prior 12 months
- Manufacturing employment edged up in June (+17,000), following four months of little change. So far this year job growth in the industry has averaged 8,000 per month, compared with an average of 22,000 per month in 2018. In June, employment rose in computer and electronic products (+7,000) and in plastics and rubber products (+4,000)
Employment in other major industries, including mining, wholesale trade, retail trade, information, financial activities, leisure & hospitality and government, showed little change during June.
Did you know…
…there are an estimated 7.58 billion people in the world today? Interestingly, the U.S. Census Bureau’s International Data Base shows that world population increased by more than 50 percent in the last 32 years.
Wages have increased at or above 3-percent year-over-year for 11 straight months.
“Real average hourly earnings increased 0.2 percent over the month in June, seasonally adjusted. Average hourly earnings increased 0.2 percent and CPI-U increased 0.1 percent. Real average weekly earnings increased 0.2 percent over the month,” according to the Bureau of Labor Statistics.
There continues to be an emphasis on investing in the American workforce through the Pledge to America’s Workers, USMCA and apprenticeship expansion, according to Acosta. In fact, the U.S. Department of Labor announced major milestones in the continuing effort to expand apprenticeship in the U.S., proposing a rule to establish a process to advance the development of high-quality Industry-Recognized Apprenticeship Programs. In addition, there will be an award of $183 million in investments to grow apprenticeship and $100 million in funding availability.
State of the Automotive Industry & Aftermarket
Strong economic growth has boosted the U.S. automotive aftermarket, which surpassed $297 billion in 2018. This exceeds the projected growth rate by nearly $1 billion, according to the 2019 Joint Channel Forecast Model produced by the Automotive Aftermarket Suppliers Association (AASA) and the Auto Care Association.
Meanwhile, the Auto Care Factbook reported positive growth in the auto care industry-now worth $405 billion-despite a year of uncertainty due to trade and tariffs.
“Consumer confidence, spending and hourly wages continue to increase, and more than 41,500 industry jobs were created last year,” said Bill Hanvey, president and CEO of the Auto Care Association.
Additionally, Paul McCarthy, president and COO of AASA, added, “This year’s report shows continued positives ahead for aftermarket growth, such as increases in vehicles in operation (VIO) and an aging vehicle parc. However, it also indicates challenges, too, such as shifts in the distribution model as consumers’ expectations for service and repair change. We believe the aftermarket will meet the challenges and opportunities ahead as it always has, through leadership, vision and entrepreneurial spirit.”
As Hanvey pointed out, there are more vehicles on the road with an average age of nearly 12 years old, which equals good business for the aftermarket. The 12-year-and-older vehicle category now represents 44 percent of total light vehicles and is growing at an annual 4 percent clip.
“Coupling that with steady miles driven, growth in e-tailing and high consumer confidence reinforces the positive outlook for the industry,” he said. “Emerging technologies such as ADAS, electrification and automation will present more opportunities for this growth to continue through 2022 and beyond.”
The 2019 Joint Channel Forecast Model predicts total aftermarket sales will grow from $297 billion in 2018 to $338 billion through 2022-a 3.3 percent compound annual growth rate (CAGR) from 2018-while the Auto Care Factbook anticipates the aftermarket to reach $448 billion by 2022.
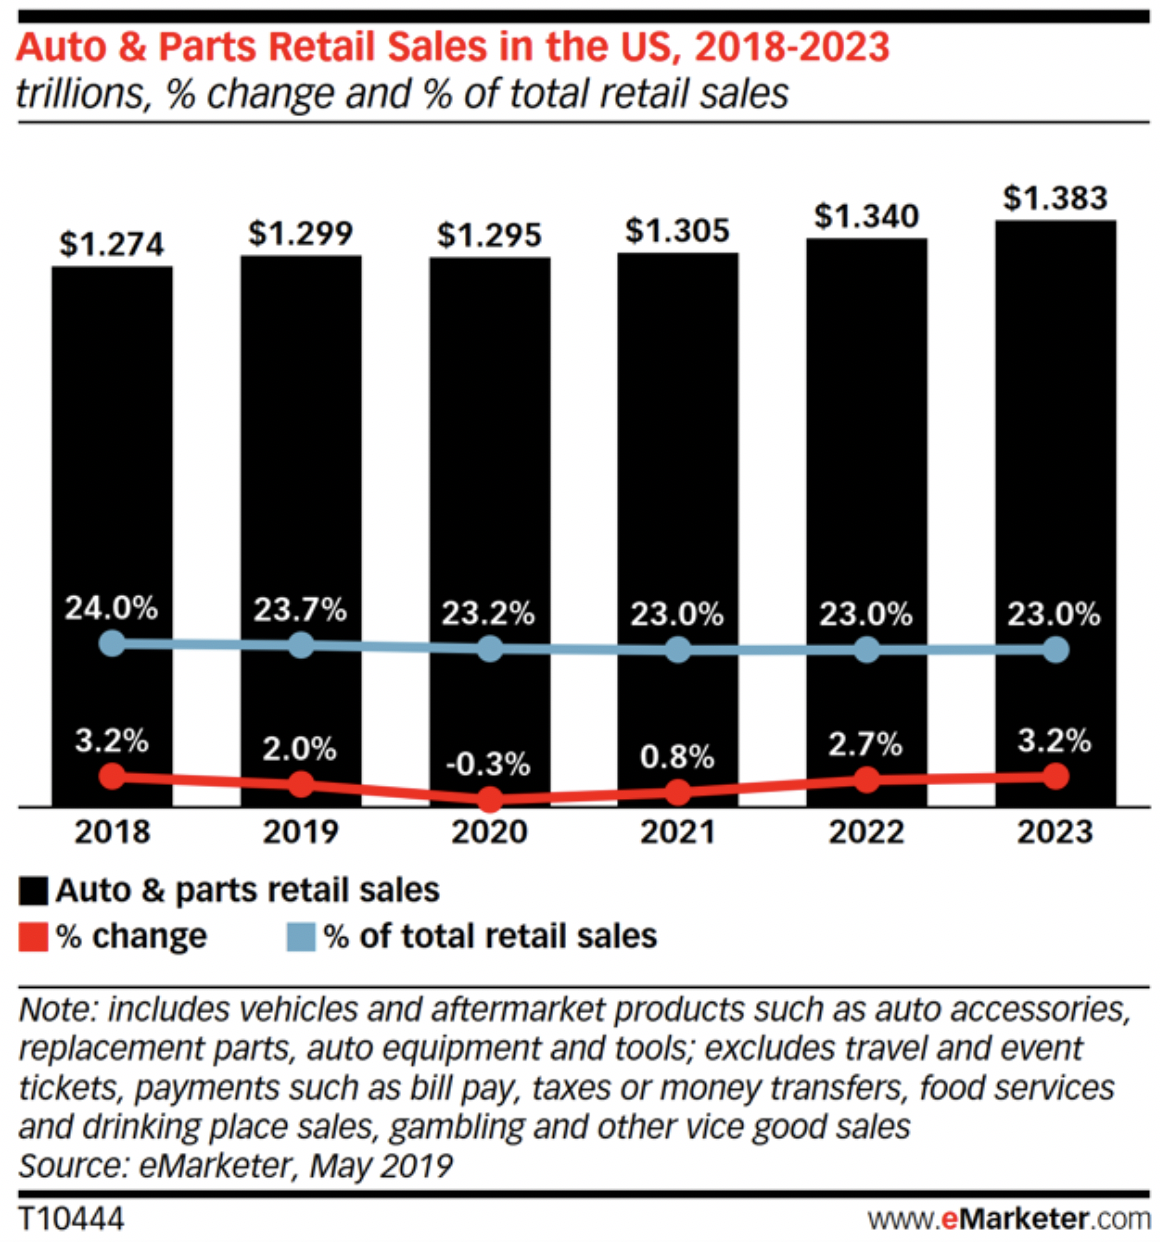
As the automotive aftermarket appears healthy, sales of cars and light trucks indicates some possible softening on the horizon. For perspective, the auto industry represents 23.7 percent of all U.S. retail sales, making it the largest retail sector and, as a result, it has a large impact on the aggregate, according eMarketer. The U.S. automotive aftermarket is benefiting from record total sales, but auto and auto parts sales as a whole are slowing across the country, which some analysts predict will weigh down the entire retail sector.
“This year, the auto industry will grow 2 percent to $1.299 trillion, the slowest growth rate since at least 2011. Growth will flatten through 2022,” according to eMarketer’s latest U.S. retail forecast.
Vehicle Sales
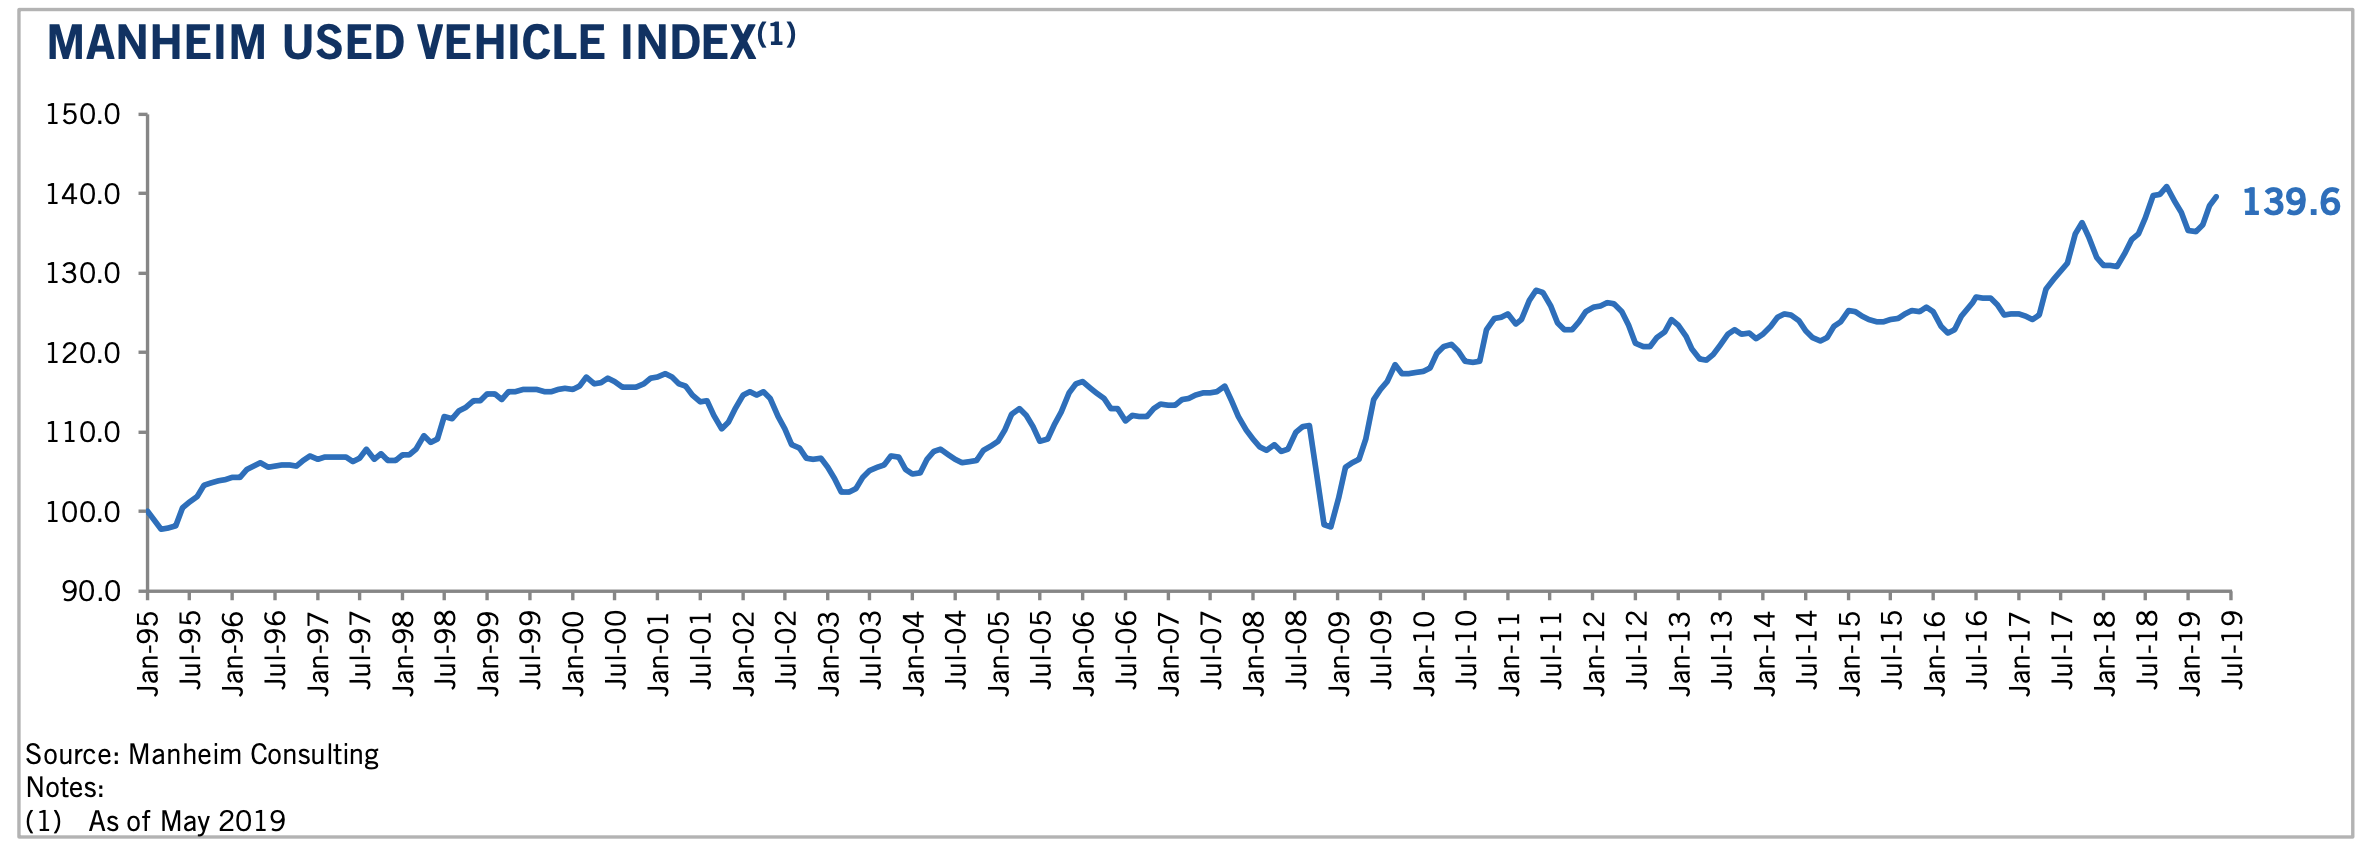
U.S. vehicles sold at a seasonally adjusted annual rate (SAAR) of 17.1 million through June, according to Manheim. “The SAAR on a three-month moving average basis was 17.1 million in June, the strongest pace in nearly a decade. Both incentive spending and inventory levels remain restrained. Indeed, in June, there were more cases of sales’ being lost due to restricted supplies, than sales being artificially boosted by manufacturer channel stuffing,” Manheim reported.
New-vehicle transaction prices were up 2.5 percent in June compared to a year ago, with Kelly Blue Book reporting an average $33,340 sale price during the month.
Meanwhile, automakers are confronting an uncertain new-vehicle market, according to Edmonds.
The commercial work truck and van industry continues to experience impressive growth. Pickups and vans were the only two major segments with higher prices year-over-year and within the commercial segment; full-size commercial passenger units and cargo vans were especially strong.
“The rise was the result of model mix shifts, higher trim levels and straight price increases. The government’s new vehicle component of the Consumer Price Index, which controls for mix and adjusts for quality increases, has risen 0.8 percent over the past year and 2.4 percent over the past three years. Given that the Manheim Index has eased over this time, the ratio between the two series has now returned to its normal range,” according to Manheim.
Graphic courtesy Jefferies Automotive Aftermarket Group
Manheim Used Vehicle Index
Total used-vehicle retail sales have rebounded after falling in the first quarter and increasing in April and May, according to National Automobile Dealers Association (NADA). Sales continue at an upward pace at 17.6 percent in June and 12.5 percent for the first half of the year.
Same-store used unit volumes were up 4.9 percent for its fiscal quarter ending May 31, according to CarMax. Analysts expect car dealership groups to show strong used-vehicle operations when they report second-quarter results later this month, according to Manheim.
Graphic courtesy Jefferies Automotive Aftermarket Group
Jeep Recall
Jeep is among a number of recent recalls reported by vehicle manufacturers and the National Highway Traffic Safety Administration (NHTSA). Nearly 83,000 Cherokee SUVs have been recalled for a problematic transmission that has plagued the vehicle since its debut.
“Last month, Jeep said it would recall 2014 Cherokees equipped with a 3.2-liter V-6 and 9-speed automatic for faulty clutches that could shift the car into neutral without warning. Jeep said it is unaware of any injuries related to the problem,” reports Aaron Cole of WFXL Fox31. “Jeep recalled 2014 Cherokees once before for similar transmission issues and has issued several updates to dealers to address poor shift quality or erratic behavior. In 2015, Jeep authorized replacements of many transmissions in 2014 Cherokees and 2015 Cherokees built before March 3, 2015.”
Jeep will begin notifying affected owners next month so that vehicles can be brought to local dealers. While Jeep didn’t say what the fix would be, they noted a remedy is under development.
RV Market
The RV Industry Associationd (RVIA), RV Dealers Association (RVDA) and members of the Outdoor Recreation Roundtable (ORR) were recently invited to the White House for a special briefing from President Donald Trump and key Cabinet members, according to RV PRO. Attending on the behalf of the RV industry were RVIA Interim President Craig Kirby and Director of Government Affairs Chris Bornemann. The goal of the roundtable was to strike a balance between policies that advance environmental stewardship and promote economic growth.
As RV PRO reported, conservation of America’s public lands and waters is integral to the environment and the $114 billion RV economy. During the roundtable, “President Trump highlighted the need to expand recreational opportunities on public lands and waters while promoting conservation and stewardship. Trump also touched on a number of issues that affect the outdoor recreation industry, including his commitment to increasing outdoor recreation access, improving forest fire management, protecting America’s land, air, and waters and the signing of the largest public lands legislation in a decade.”
Trump said he signed the largest public lands package in a decade, designating 1.3 million acres of new wilderness and expanding recreational access. “My administration is strongly promoting bipartisan solutions for conservation,” Trump said.
Attendees like Kirby found it encouraging to hear the President talk about the need to expand recreational opportunities, while protecting the great outdoors. “The President’s priorities on clean air, water and keeping the outdoors safe and enjoyable for Americans-and the millions of American RVers-”means our message has been getting through at the highest levels,” he said.
Auto Lease Activity
Graphic courtesy of swapalease.com
Consumer Confidence
The Conference Board Consumer Confidence Index declined in June after increasing in May. The Index stands at 121.5, which is down from 131.3 the month prior.
Furthermore, the Present Situation Index, rooted in consumers’ assessment of current business and labor market conditions, decreased from 170.7 to 162.6. The Expectations Index, based on consumers’ short-term outlook for income, business and labor market conditions, decreased from 105 last month to 94.1 this month.
Other takeaways from the Conference Board include:
- Consumers were less optimistic about the short-term outlook in June. The percentage of consumers expecting business conditions will be better six months from now decreased from 21.4 percent to 18.1 percent, while those expecting business conditions will worsen rose from 8.8 percent to 13.1 percent.
- Consumers’ outlook for the labor market was also less favorable. The proportion expecting more jobs in the months ahead decreased from 18.4 percent to 17.3 percent, while those anticipating fewer jobs increased from 13 percent to 14.8 percent. Regarding their short-term income prospects, the percentage of consumers expecting an improvement decreased from 22.2 percent to 19.1 percent, while the proportion expecting a decrease inched up from 7.8 percent to 8 percent.
“After two consecutive months of improvement, Consumer Confidence declined in June to its lowest level since September 2017 (Index, 120.6),” said Lynn Franco, senior director of economic indicators at the Conference Board. “The decrease in the Present Situation Index was driven by a less favorable assessment of business and labor market conditions. Consumers’ expectations regarding the short-term outlook also retreated. The escalation in trade and tariff tensions earlier this month appears to have shaken consumers’ confidence. Although the Index remains at a high level, continued uncertainty could result in further volatility in the Index and, at some point, could even begin to diminish consumers’ confidence in the expansion.”
Such data is in contrast with the underlying tone of THE SHOP‘s Key Performance Indicator Report – July, which pointed to a common denominator of growth, including revitalization of the economy, expansion of the job market and an unemployment status continuing to trend low.
Infrastructure
The current presidential administration has been forthcoming about its position on investing in modern infrastructure, with many roads, bridges, railways and buildings across the country in serious need of repair or replacement.
“In the past five years, the amount of investment in construction-technology companies continues to rise, as investors look at this market as one that is ripe for innovation,” according to Construction Tech, an advocate for the construction industry.
The company’s recent feature coverage “suggests that venture capitalists’ interest in investing in global construction technology startups in the first half of 2018 was 30 percent above the 2017 total. In fact, it says the total funding since 2009 is roughly $4.34 billion, with 478 funding deals since that time.”
When looking at the industry as a whole instead of just the startup market, McKinsey estimated that number to be higher-at roughly $10 billion in investment funding for construction-technology firms from 2011 through early 2017, which includes technology throughout the entire construction lifecycle of a facility.
Construction Tech poses the question, for an industry that needs advanced solutions to complete complex projects in a quicker timeline, technology could be the solution. Investors recognize this, and so should the aftermarket.
Small Business Index
America’s small business owners’ optimism took a slight downturn in June-slipping 1.7 points to 103.3, with six components falling, three improving and one unchanged-while The Uncertainty Index rose substantially, increasing seven points to the highest level since March 2017. However, overall optimism remains at historically high levels, according to the National Federation of Independent Business (NFIB) Research Foundation.
“Last month, small business owners curbed spending, sales expectations and profits both fell and the outlook for expansion dampened. When you add difficulty finding qualified workers and harmful state level laws and regulations, you’re left with a volatile mix where uncertainty has increased to levels not seen in more than two years,” said NFIB President and CEO Juanita D. Duggan.
“As expectations for sales gains and the general business environment faded, uncertainty levels increased,” added NFIB Chief Economist William Dunkelberg. “Still, job openings and plans to create jobs remain historically very strong, and while it’s not as ‘hot’ as May, Main Street is still running strong.”
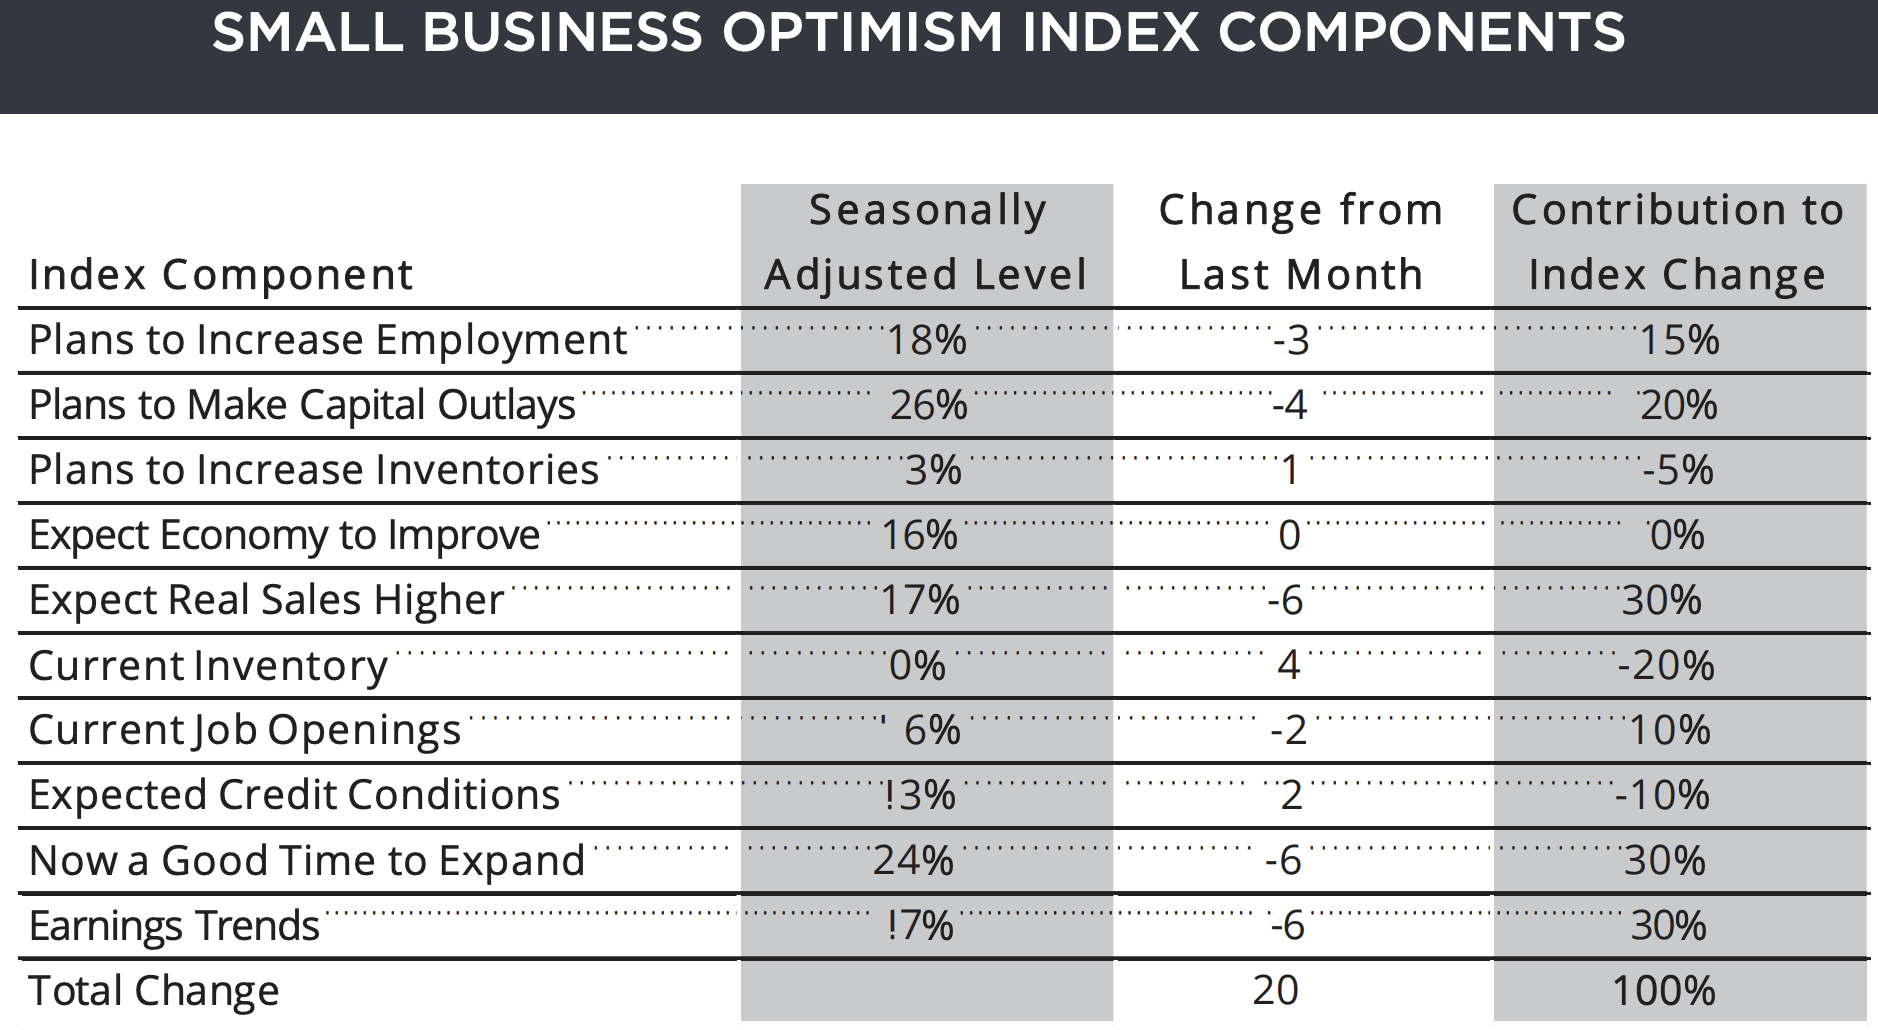
Graphic courtesy of NFIB
Key points directly from NFIB’s full report include:
- Both capital spending plans and reports of actual spending fell in June, reversing last month’s gains. The inventory component strengthened in June with owners saying existing inventory stocks were lean and planning to add to them. Sales and earnings trends softened, while expected credit conditions remained favorable. More owners expect credit conditions to tighten rather than ease by a two-to-one margin, with most expecting no change.
- Twenty-six percent of business owners plan capital outlays in the next few months, down four points, and an indication there is more reluctance to make major spending commitments when the future becomes less certain. Fifty-four percent reported capital outlays, down 10 points. Of those making expenditures, 40 percent reported spending on new equipment (down four points), 22 percent acquired vehicles (down seven points) and 12 percent improved or expanded facilities (down seven points).
- The net percent of owners reporting inventory increases fell two points to a net zero percent, indicating no further building in inventory stocks in June. The net percent of owners viewing current inventory stocks as “too low” rose four points to a net zero percent, overall balance. Major imbalances reported in May have been resolved in most industries with the exception of manufacturing (18 percent too large, 5 percent too low) and agriculture (8 percent too large, 14 percent too low). The net percent of owners planning to expand inventory holdings did increase one point to a net 3 percent, a solid number.
- A net seven percent of all owners (seasonally adjusted) reported higher nominal sales in the past three months, down 2 percent, but a very solid reading. The net percent of owners expecting higher real sales volumes fell six points to a net 17 percent of owners. Excluding the government shutdown earlier this year, this is the weakest reading since September 2017.
- The frequency of reports of positive profit trends slipped six points to a net negative seven percent reporting quarter on quarter profit improvements. Twenty-seven percent of those reporting weaker profits blamed sales (down 3 percent), 12 percent blamed labor costs (up 5 percent), 11 percent cited materials costs and 9 percent cited lower selling prices (down two points).
Three percent of owners reported that all their borrowing needs were not satisfied, unchanged and historically very low. Twenty-nine percent reported all credit needs met (down 5 percent) and 55 percent said they were not interested in a loan, up one point. A record low two percent reported their last loan was harder to get than the previous one. Two percent reported that financing was their top business problem (unchanged) compared to 21 percent citing the availability of qualified labor, 18 percent citing taxes, 13 percent regulations and red tape.
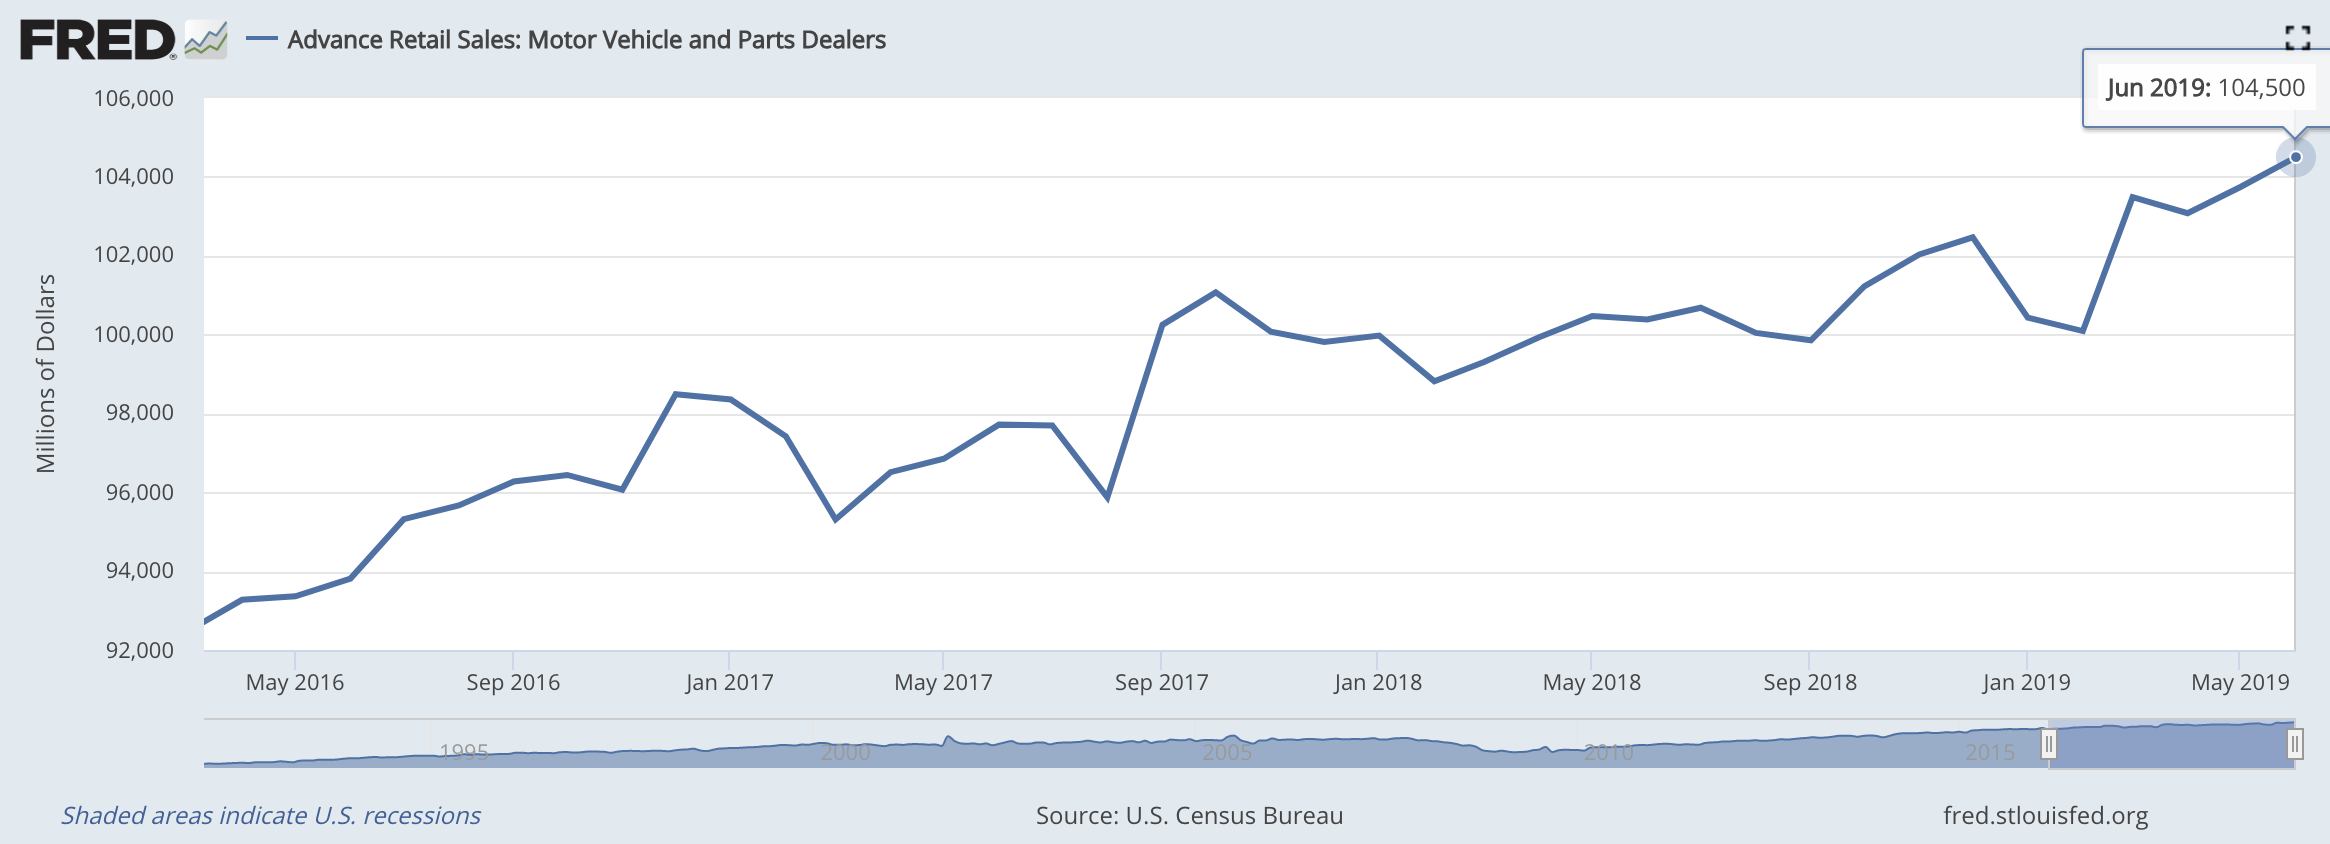
Advance Retail Sales: Motor Vehicle and Parts Dealers
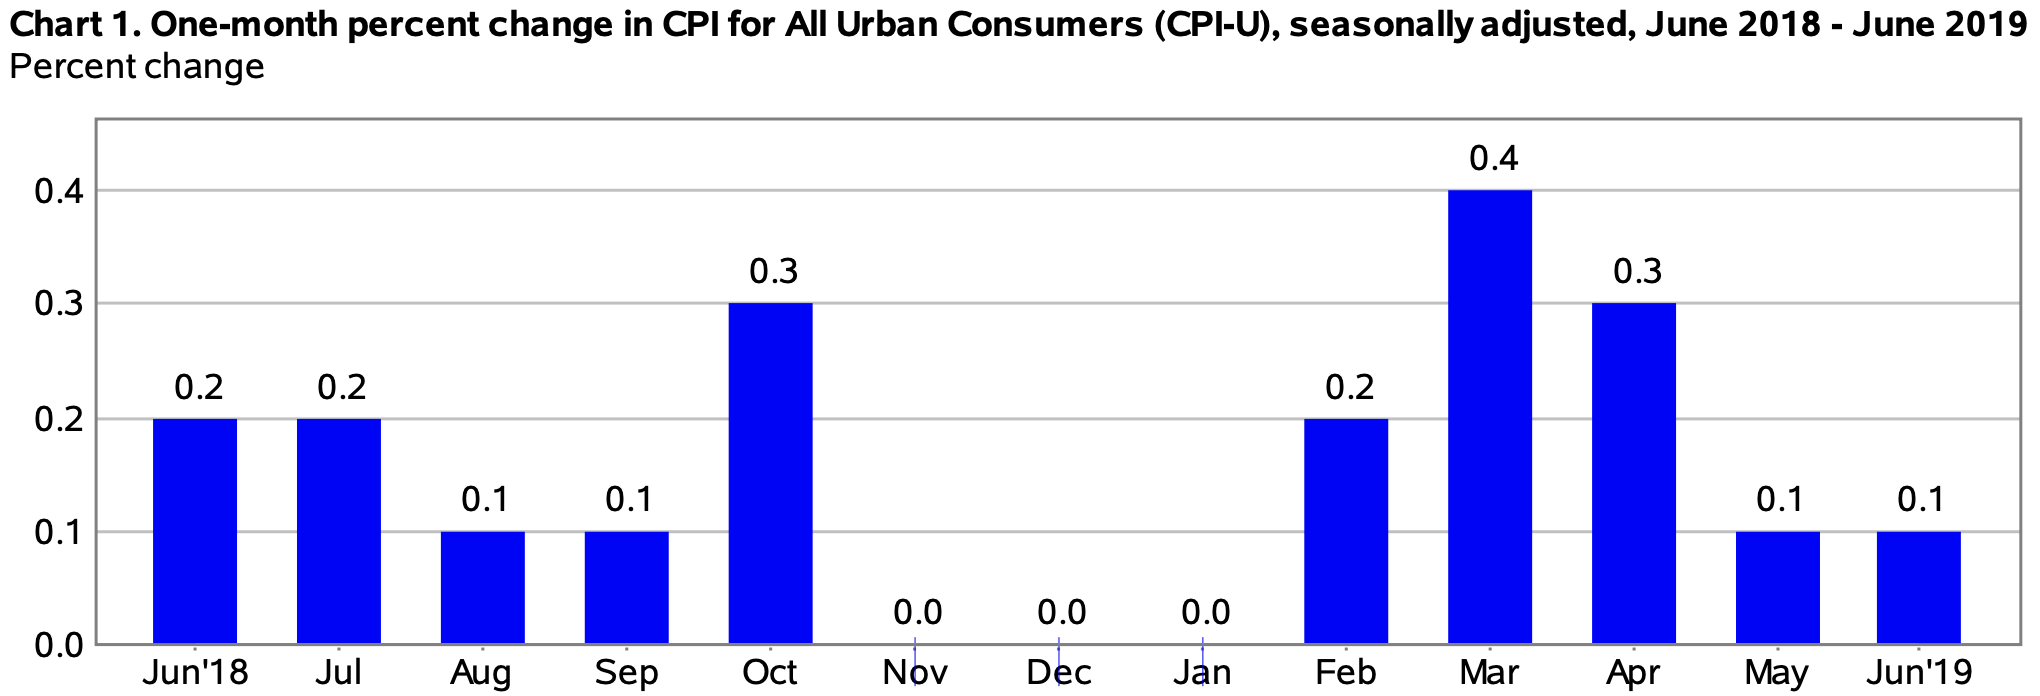
Consumer Price Index
The Consumer Price Index for All Urban Consumers (CPI-U) increased 0.1 percent in June on a seasonally adjusted basis. This is the same increase as in May, according to the U.S. Bureau of Labor Statistics. Additionally, over the last 12 months, the all items index increased 1.6 percent before seasonal adjustment.
“Increases in the indexes for shelter, apparel, as well as used cars and trucks more than offset declines in energy indexes to result in the seasonally adjusted all items monthly increase in June. The index for all items less food and energy rose 0.3 in June, its largest monthly increase since January 2018. Along with the indexes for shelter, used cars and trucks and apparel, the indexes for household furnishings and operations, medical care and motor vehicle insurance were among the indexes that increased in June. The indexes for recreation, airline fares and personal care all declined in June,” states the U.S. Bureau of Labor Statistics.
Furthermore, the all items index increased 1.6 percent for the 12 months ending June, which is a smaller increase than the 1.8 percent rise for the period ending May. Also, the index for all items less food and energy rose 2.1 percent over the last 12 months, and the food index increased 1.9 percent. As reported, the energy index, in contrast, declined 3.4 percent over the last 12 months.
Graphic courtesy of Bureau of Labor Statistics
Manufacturing ISM
Economic activity in the manufacturing sector expanded in June and the overall economy grew for the 122nd consecutive month, according to the nation’s supply executives in the latest Manufacturing ISM Report On Business. The June PMI registered at 51.7 percent, a decrease of 0.4 percentage point from the May reading of 52.1 percent.
The Report On Business measures its data using the Purchasing Manager’s Index (PMI), which is an indicator of economic health in the manufacturing sector. A reading above 50 percent indicates that the manufacturing economy is generally expanding, while below 50 percent indicates that it is generally contracting.
“Comments from the panel reflect continued expanding business strength, but at soft levels; June was the third straight month with slowing PMI expansion,” said Timothy R. Fiore, chair of the Institute for Supply Management Manufacturing Business Survey Committee. “Demand expansion ended, with the New Orders Index recording zero expansion, the Customers’ Inventories Index remaining at a too-low level, and the Backlog of Orders Index contracting for the second straight month.
“New export orders remain weak. Consumption (measured by the production and employment indexes) continued to expand, resulting in a combined increase of 3.6 percentage points. Inputs-expressed as supplier deliveries, inventories and imports-were lower this month, due to inventory contraction and suppliers continuing to deliver faster, resulting in a combined 3.1-percentage point reduction in the Supplier Deliveries and Inventories indexes.
“Imports registered zero expansion. Overall, inputs indicate supply chains are responding faster and supply managers are again closely watching inventories. Prices contracted for the first time since February. Respondents expressed concern about U.S.-China trade turbulence, potential Mexico trade actions and the global economy,” Fiore said.
Of the 18 manufacturing industries, 12 reported growth in June, in the following order: Furniture & Related Products; Printing & Related Support Activities; Textile Mills; Nonmetallic Mineral Products; Food, Beverage & Tobacco Products; Petroleum & Coal Products; Chemical Products; Computer & Electronic Products; Paper Products; Miscellaneous Manufacturing; Electrical Equipment, Appliances & Components; and Machinery.
The five industries that reported contraction in June were: Apparel, Leather & Allied Products; Primary Metals; Wood Products; Transportation Equipment; and Fabricated Metal Products.
Commodities up in price: Corn; Printed Circuit Board Assemblies; Soybean Products; and Steel Products* (2).
Commodities down in price: Aluminum (3); Copper; Corrugated Boxes; Lumber Products; Memory; Natural Gas (2); Scrap Metal (2); Cold-Rolled Steel; Hot-Rolled Steel; Stainless Steel; and Steel Products* (6).
Commodities in short supply: Capacitors (3); Electrical Components; Electronic Components (14); and Integrated Circuits (2).
*The number of consecutive months the commodity is listed is indicated after each item. *Indicates both up and down in price.
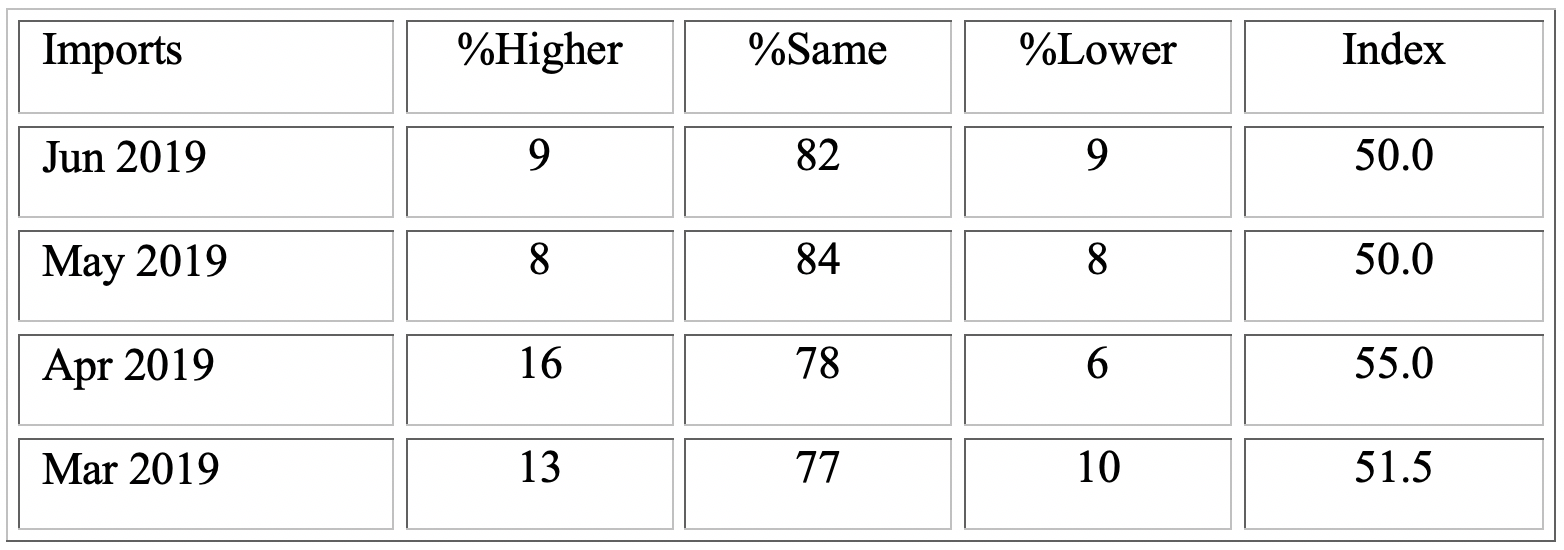
Import and Exports
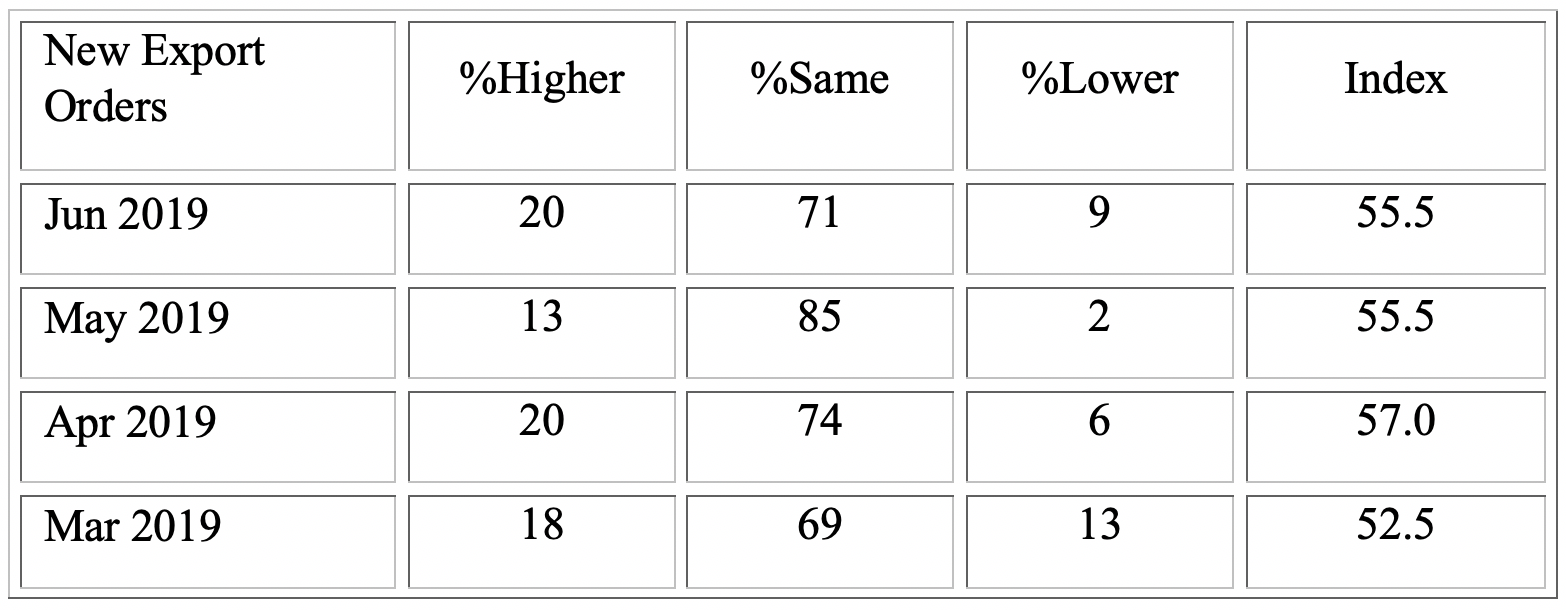
Orders and requests for services and other non-manufacturing activities to be provided outside of the U.S. by domestically based personnel grew for the 29th consecutive month. The New Export Orders Index registered 55.5 percent in June, which is the same reading that was reported in May. Of the total respondents in June, 62 percent indicated they either do not perform, or do not separately measure, orders for work outside of the U.S.
The eight industries reporting an increase in new export orders in June are listed in order: Real Estate, Rental & Leasing; Agriculture, Forestry, Fishing & Hunting; Information; Construction; Mining; Finance & Insurance; Wholesale Trade; and Professional, Scientific & Technical Services.
The six industries that reported a decrease in exports in June are listed in order: Utilities; Arts, Entertainment & Recreation; Educational Services; Retail Trade; Management of Companies & Support Services; and Other Services.
The Imports Index was unchanged, registering 50 percent in June for the second month in a row. Forty-eight percent of respondents reported that they do not use, or do not track the use of, imported materials.
The four industries reporting an increase in imports for the month of June are: Agriculture, Forestry, Fishing & Hunting; Mining; Wholesale Trade; and Professional, Scientific & Technical Services.
The seven industries that reported a decrease in imports in June listed in order are: Real Estate, Rental & Leasing; Arts, Entertainment & Recreation; Management of Companies & Support Services; Transportation & Warehousing; Accommodation & Food Services; Retail Trade; and Other Services. Seven industries reported no change in imports in June as compared to May.