- KPI – February 2026: State of Business – Automotive Industry
- KPI – February 2026: State of Manufacturing
- KPI – February 2026: State of the Economy
- KPI – February 2026: Consumer Trends
- KPI – February 2026: Recent Vehicle Recalls
The Fiserv Small Business Index was 142.6 in January, reflecting year-over-year growth of 0.7%, but a month-over-month decline of 0.5%. The Fiserv Small Business Transaction Index registered 101.9, a year-over-year decrease of 2% and a month-over-month dip of 0.8%. According to index data, these results indicate a slight contraction in consumer activity compared to December 2025.
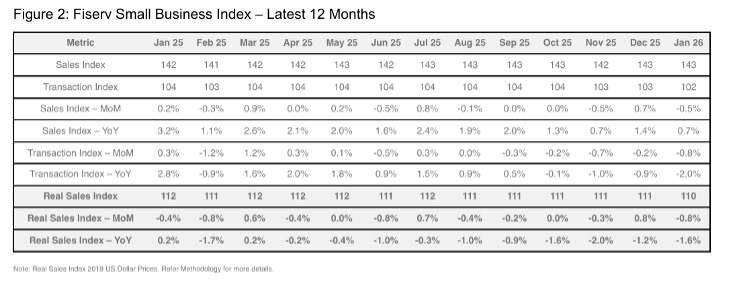
Key Takeaways, Courtesy of The Fiserv Small Business Sales Index:
- January sales slowed, as weather and seasonal reset weighed on consumer activity. January sales grew 0.7% year-over-year but slipped 0.5% month-over-month, “signaling softer momentum” to kickstart the year. In addition, foot traffic declined 2% year-over-year (its slowest pace since mid‑2022) and 0.8% month-over-month (the weakest in 11 months). Restaurants, hotels and several retail categories saw sharp slowdowns, while select service sectors posted modest gains.
- Administrative & Support Services gained 1.1% month-over-month, lifted by storm‑related service needs. Tax Preparation Services recorded strong seasonal acceleration, up 5.6% month-over-month and 9.3% year-over-year. The broader Professional Services sector remained solid at +5.1% year-over-year, despite a slight 0.2% month-over-month dip.
- Small business retail sales were essentially unchanged, up 0.1% year-over-year but down 0.1% month-over-month. “Foot traffic rose both year-over-year (1.2%) and month-over-month (1%), suggesting consumers remained active but have become increasingly selective,” according to the most recent report. Core retail delivered the gains, up 1.5% year-over-year and 0.5% month-over-month, while non‑core retail fell 2.7% year-over-year and 1.2% month-over-month.
- Discretionary spending softened, while essentials remained stable. Discretionary sales fell 0.4% year-over-year and 0.7% month-over-month, with even steeper foot‑traffic declines at 2.4% year-over-year and 1.1% month-over-month. Essentials remained strong, up 2.2% year-over-year but flat month-over-month.
- Restaurant performance weakened as visits dropped sharply. Restaurant sales fell 1.8% year-over-year, driven by foot‑traffic declines of 3.6% year-over-year. Limited‑service restaurants posted the largest drops, down 3.4% year-over-year and 2% month-over-month, alongside steep foot traffic losses of 5% year-over-year. Average ticket sizes rose 1.6% year-over-year, offering only a partial offset. Full‑service dining also softened, though less severely.
Despite facing extraordinary economic pressure, the small business sector continues to demonstrate perseverance. The NFIB Small Business Optimism Index registered 99.3 in January—dipping 0.2 points month-over-month but remaining above the 52-year average of 98. Of the 10 Optimism Index components, three increased and seven decreased. Expected real sales volume was the only component with substantial change, increasing by six points. The Uncertainty Index rose seven points from December to 91. A rise in owners reporting uncertainty about whether it is a good time to expand their business was the primary driver of the rise in the Uncertainty Index.
“While GDP is rising, small businesses are still waiting for noticeable economic growth. Despite this, more owners are reporting better business health and anticipating higher sales,” says Bill Dunkelberg, NFIB chief economist.
Important Takeaways, Courtesy of NFIB:
- 13% reported the cost or availability of insurance as their single most important problem, up four points from December. The last time insurance reached this percentage was December 2018.
- 60% of small business owners reported capital outlays in the last six months, up four points from December and the highest level since November 2023.
- A net negative 6% of owners reported paying a higher interest rate on their most recent loan, down three points from December. This suggests that credit markets are turning more favorable for small borrowers.
- 16% of small business owners cited labor quality as their single most important problem, down three points from December. This is the third consecutive month that labor quality, reported as the single most important problem, has declined.
- The net percent of owners expecting higher real sales volumes over the next quarter rose six points from December to a net 16% (seasonally adjusted).
- The net percent of owners reporting inventory gains rose four points to a net 3% (seasonally adjusted), the highest reading since January 2023. Not seasonally adjusted, 14% reported increases in stocks (up one point), and 17% reported reductions (up two points).
- 62% of small business owners reported that supply chain disruptions were affecting their business to some degree, down two points from December. Four percent reported a significant impact (up one point), 17% reported a moderate impact (down four points), 41% reported a mild impact (up one point) and 37% reported no impact (up two points).
- The net percent of owners raising average selling prices fell four points to a net 26% (seasonally adjusted). Price increases remain well above the historical average of a net 13%, suggesting continued inflationary pressure. Looking ahead, a net 32% (seasonally adjusted) plan to increase prices, up four points from December.
- Overall, reported business health improved, with more reporting it as excellent and fewer reporting it as fair. When asked to evaluate the overall health of their business, 14% rated it as excellent (up five points), 54% rated it as good (unchanged), 27% rated it as fair (down seven points) and 4% rated it as poor (up one point).
Professionals in the automotive, RV and powersports industries remain steadfast in their efforts to evolve their business models and grow their brands in the face of adversity. As such, the monthly Key Performance Indicator Report serves as an objective wellness check on the overall health of our nation, from the state of manufacturing and vehicle sales to current economic conditions and consumer trends. Below are a few key data points explained in further detail throughout the report.
Key Data Points:
- In January, economic activity in the manufacturing sector expanded for the first time in 12 months, preceded by 26 straight months of contraction, according to the nation’s supply executives in the latest ISM Manufacturing PMI Report. The Manufacturing PMI registered 52.6% in January, a 4.7 percentage point increase compared to the seasonally adjusted reading of 47.9% in December.
- The Global Light Vehicle (LV) selling rate declined sharply to 81 million units per year due to a steep contraction in the Chinese PV market. The market decreased 2% year-over-year, as sales totaled 6.6 million units globally.
- Total new-vehicle sales for February 2026, including retail and non-retail transactions, are projected to reach 1,183,000—a 3.8% year-over-year decrease, according to a joint forecast from JD Power and GlobalData.
- Powersports Business says dealers across the country reported an incline of 10% in combined same-store sales compared to the same month last year, according to composite data from more than 1,700 dealerships in the U.S. that utilize CDK Lightspeed DMS. On average, dealerships were up 10.4% in major units, 8.6% in parts and 7.9% in service.
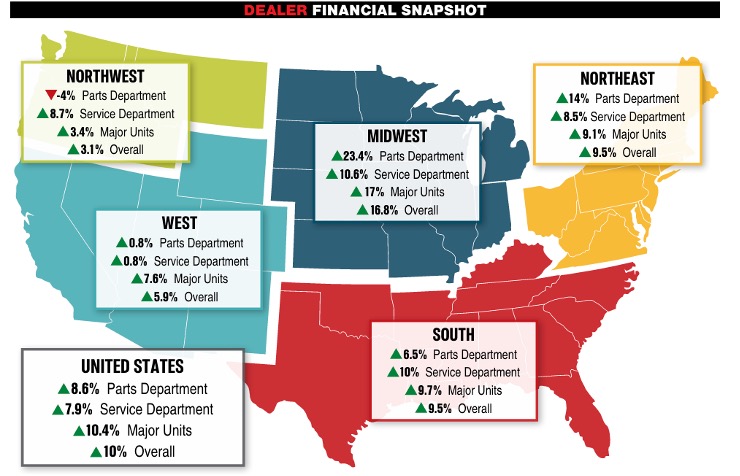
Image Source: Powersports Business