
KPI – February 2026: The Brief
KPI – February 2026: State of Business – Automotive Industry
KPI – February 2026: State of Manufacturing
KPI – February 2026: Consumer Trends
KPI – February 2026: Recent Vehicle Recalls
Employment
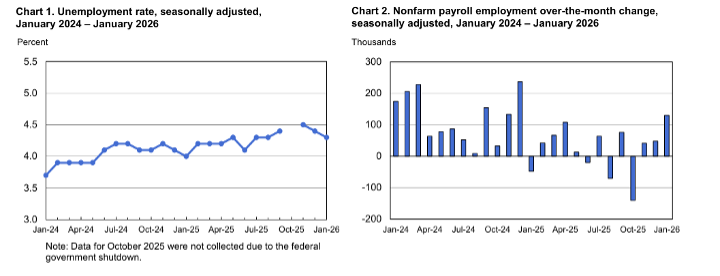
Total nonfarm payroll employment was 130,000 in January – above the Dow Jones estimate of 55,000. Employment continued to trend up in healthcare, social assistance and construction, while federal government and financial activities lost jobs.
According to the U.S. Bureau of Labor Statistics, the unemployment rate and number of unemployed persons edged down to 4.3% and 7.4 million, respectively. In addition, the labor force participation and long-term unemployed (those jobless for 27 weeks or more) rates registered 62.5% and 25%, respectively.
While the number of long-term unemployed (those jobless for 27 weeks or more) changed little month-over-month at 1.8 million, it was up by 386,000 from a year earlier. According to the report, a more encompassing measure includes discouraged workers and those holding part-time positions for economic reasons, which slipped to 8% – down 0.4 percentage point from December.
“It was a January job surge,” says Heather Long, chief economist at Navy Federal Credit Union. “The surprisingly strong job gains in January were driven mainly by healthcare and social assistance. But it is enough to stabilize the job market and send the unemployment rate slightly lower. This is still a largely frozen job market, but it is stabilizing. That’s an encouraging sign to start the year, especially after the hiring recession in 2025.”
 By Demographic
This month, unemployment among the major worker groups: adult women – 4.0%; adult men – 3.8%; teenagers – 13.6%; Asians – 4.1%; Whites – 3.7%; Hispanics – 4.7%; and Blacks – 7.2%.
Last month, unemployment among the major worker groups: adult women – 3.9%; adult men – 3.9%; teenagers – 15.7%; Asians – 3.6%; Whites – 3.8%; Hispanics – 4.9%; and Blacks – 7.5%.
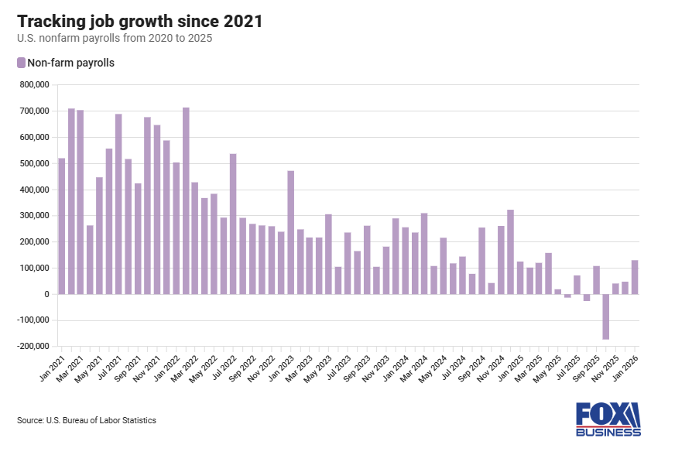
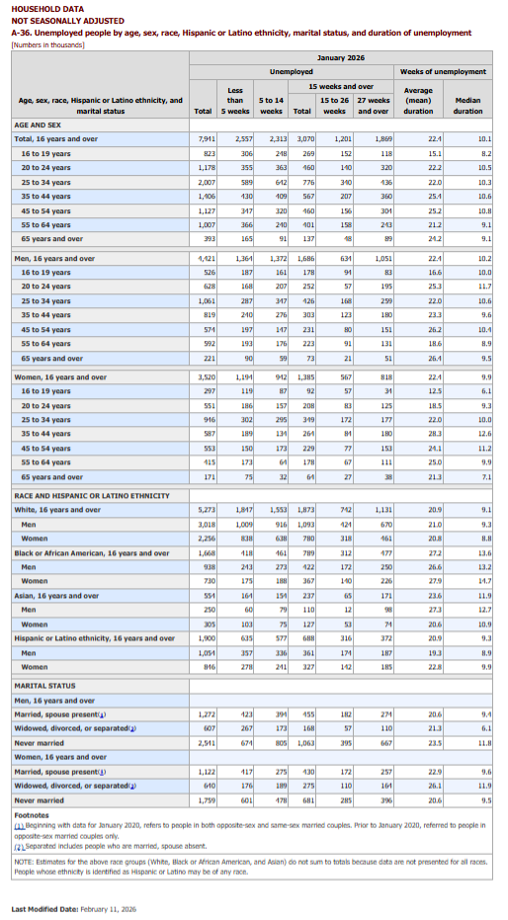 Image Source: A-36. Unemployed persons by age, sex, race, Hispanic or Latino ethnicity, marital status, and duration of unemployment (bls.gov).
By Industry
The Conference Board Employment Trends Index (ETI) increased from an upwardly revised 104.51 in December to 105.06 in January.
January’s increase in the Employment Trends Index was a result of positive contributions from six of its eight components: Initial Claims for Unemployment Insurance, the Number of Employees Hired by the Temporary-Help Industry, the Ratio of Involuntarily Part-Time to All Part-Time Workers, Real Manufacturing and Trade Sales, Industrial Production and Job Openings. Two components contributed negatively: the Percentage of Respondents Who Say They Find Jobs Hard to Get and the Percentage of Firms with Positions Not Able to Fill Right Now.
“The ETI’s rise in January reflected a stronger-than-expected Employment Report with healthy payroll growth,” says Mitchell Barnes, economist at The Conference Board. “Unemployment and layoffs continue to remain mild, suggesting that the labor market is in balance despite a low 2025 hiring rate.”
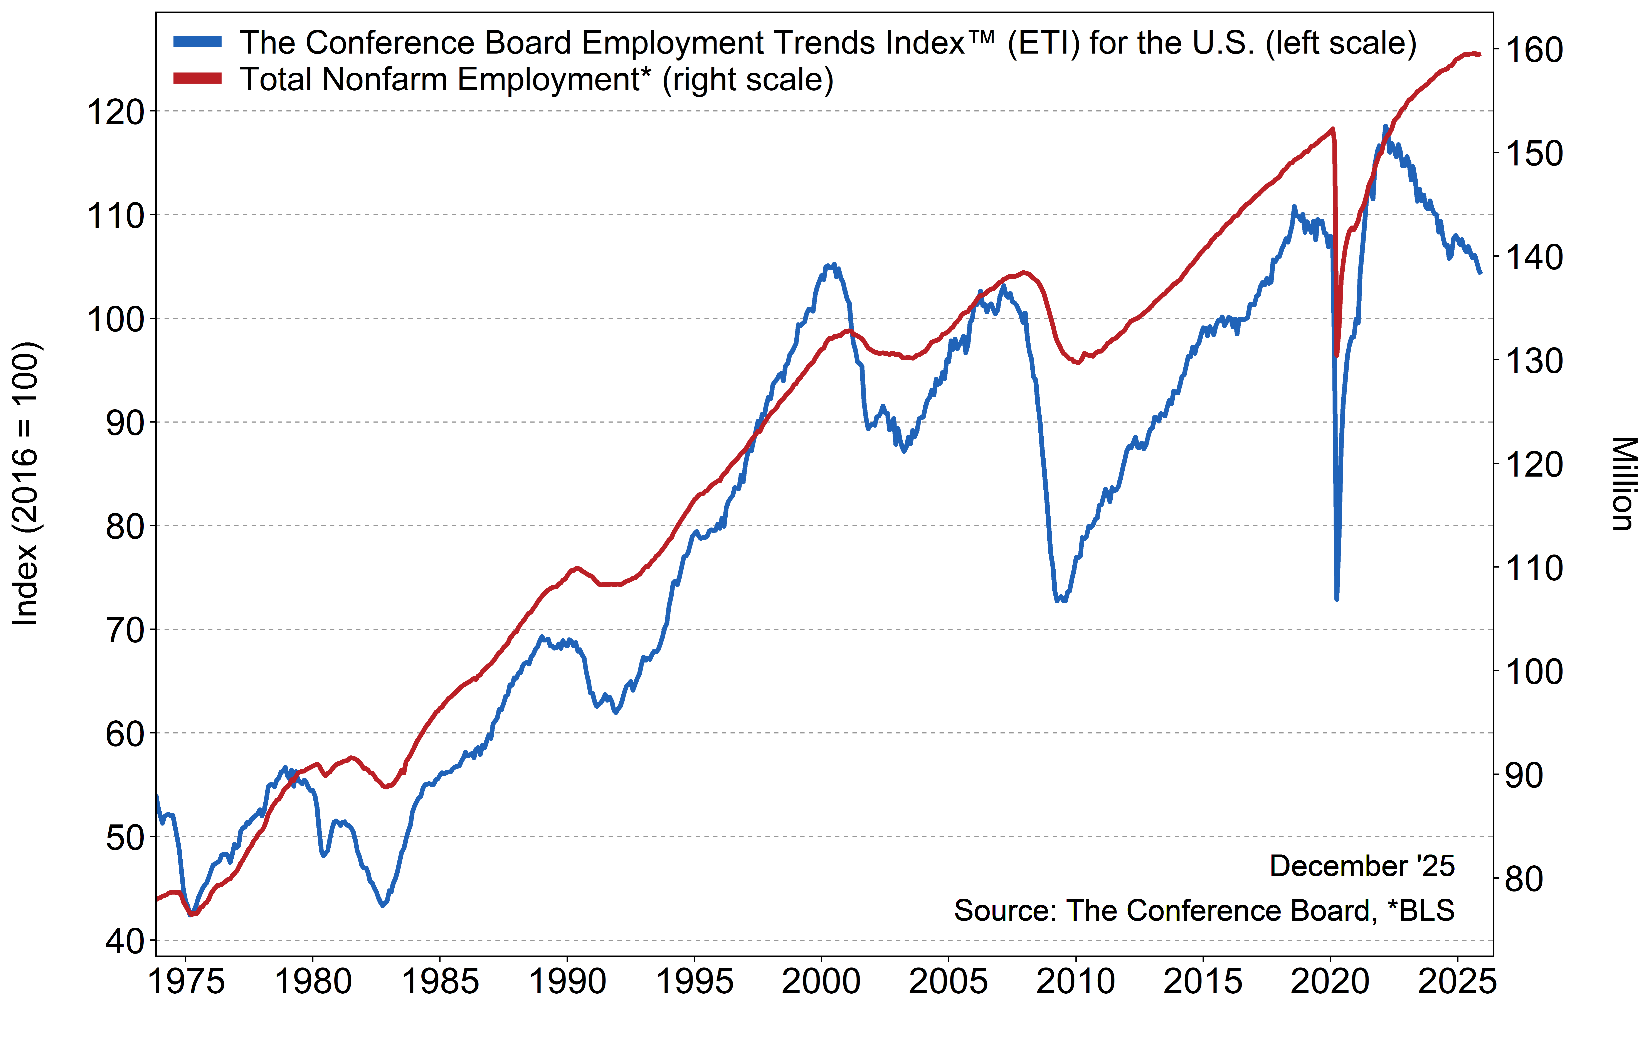
Caption: The Employment Trends Index is a leading composite index for payroll employment. When the Index increases, employment is likely to grow as well, and vice versa. Turning points in the Index indicate that a change in the trend of job gains or losses is about to occur in the coming months.
Barnes cites the share of consumers who report “jobs are hard to get” – an ETI component from the Consumer Confidence Survey – rose to 20.8% in January to reach the highest point since early 2021. The share of small firms reporting that jobs are “not able to be filled right now” fell to a post-pandemic low of 31% in January, while the net share of small firms that plan to increase employment fell to a three-month low.
Key Takeaways, Courtesy of ETI:
- Initial claims for unemployment insurance declined in January, continuing to fall from mid-2025 highs.
- The share of involuntary part-time workers also declined in January to 17.6%, the lowest percentage since September.
- Real manufacturing and trade sales and industrial production continued to show steadiness despite other measures of manufacturing activity and employment indicating contraction.
“While most labor market indicators suggest relative stability, the confidence of consumers and businesses point in a negative direction,” Barnes says. “It remains to be seen whether 2026 will continue the theme of a low-hire, low-fire environment.”
Click here to view more detailed information by industry.