
- KPI – September 2025: The Brief
- KPI – September 2025: Recent Vehicle Recalls
- KPI – September 2025: State of Business – Automotive Industry
- KPI – September 2025: State of Manufacturing
- KPI – September 2025: Consumer Trends
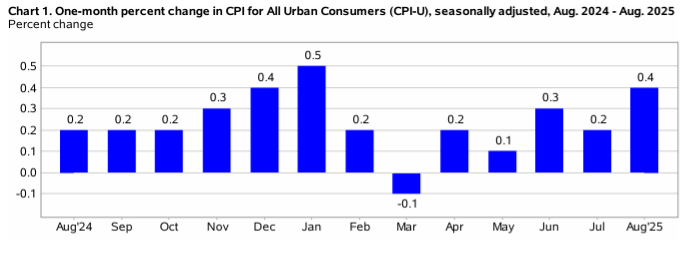
In August, The Consumer Price Index for All Urban Consumers (CPI-U) increased 0.4% on a seasonally adjusted basis after rising 0.2% in July, according to the U.S. Bureau of Labor Statistics. Over the last 12 months, the all-items index increased 2.9% before seasonal adjustment.
Important Takeaways, Courtesy of the U.S. Bureau of Labor Statistics:
- The index for shelter rose 0.4% in August, serving as the largest factor in the all-items monthly increase. The food index ticked up 0.5% month-over-month, as the food-at-home index rose 0.6% and the food-away-from-home index increased 0.3%. Likewise, the index for energy edged up 0.7%, as the index for gasoline increased 1.9% since last month.
- Indexes on the rise include airline fares, used cars and trucks, apparel and new vehicles. The indexes for medical care, recreation and communication were among the few major indexes to decrease in August.
Overall, the all-items index rose 2.9% month-over-month. The food and energy indexes increased 3.2% and 0.2%, respectively, while the all-items-less-food-and-energy index rose 3.1%.
Employment
Total non-farm payroll employment gained 22,000 in August – below Dow Jones’ forecast of 75,000. June totals were revised down 13,000, while July gains were adjusted up 6,000. A job boost in health care was partially offset by losses in federal government, as well as mining, quarrying and oil and gas extraction.
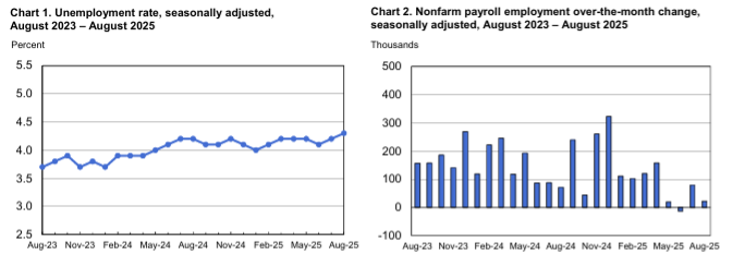
According to the U.S. Bureau of Labor Statistics, the unemployment rate and number of unemployed persons edged up to 4.3% and 7.4 million, respectively. In addition, the labor force participation and long-term unemployed (those jobless for 27 weeks or more) rates registered 62.3% and 25.7%, respectively.
“The job market is stalling short of the runway,” says Daniel Zhao, chief economist at jobs site Glassdoor. “The labor market is losing lift, and August’s report, along with downward revisions, suggests we’re heading into turbulence without the soft landing achieved.”
While hiring was slow, stocks were up and average hourly earnings increased 0.3% for the month, meeting the estimate – though the annual gain of 3.7% was slightly below the forecast for 3.8%, according to CNBC.
Seema Shah, chief global strategist at Principal Asset Management, expressed a slightly different perspective, stating the August jobs report “just about strikes a balance between reinforcing market expectations for a sequence of Fed rate cuts and not yet inviting renewed concerns around recession, so the broad market response should be mildly positive.”
Though, she agrees concerns about the health of the economy are starting to creep in.
“[Any] further deterioration in the labor market would soon tip the balance to ‘bad news is simply bad news,’” she continues. “Equally, a strong inflation print could strike new fears about a stagflationary mix.”
By Demographic
This month, unemployment rates among the major worker groups: adult women – 3.8%; adult men – 4.1%; teenagers – 13.9%; Asians – 3.6%; Whites – 3.7%; Hispanics – 5.3%; and Blacks – 7.5%.
Last month, unemployment rates among the major worker groups: adult women – 3.7%; adult men – 4%; teenagers – 15.2%; Asians – 3.9%; Whites – 3.7%; Hispanics – 5%; and Blacks – 7.2%.
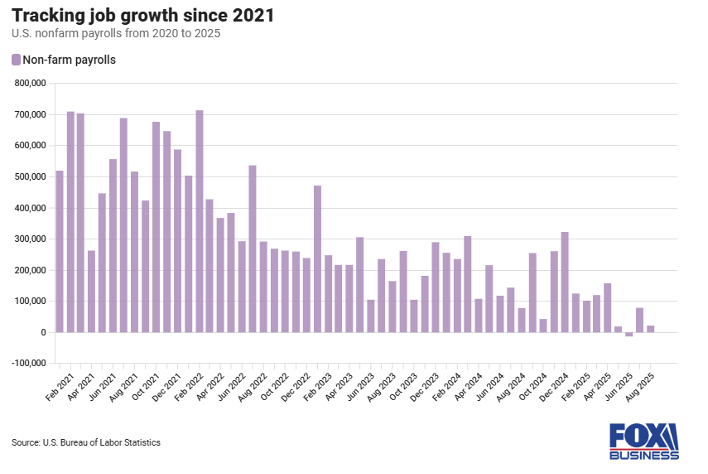
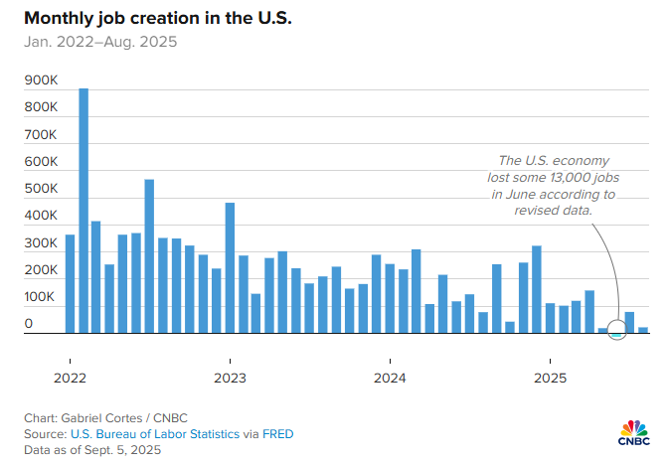
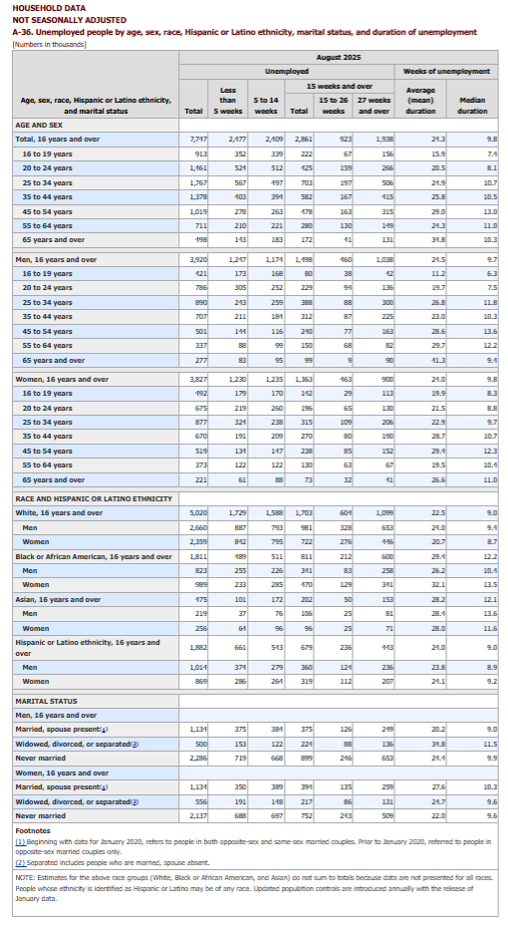 Image Source:
 By Industry
The Conference Board Employment Trends Index (ETI) declined in August to 106.41, from a downwardly revised 107.13 in July.
The monthly decrease in the ETI was a result of negative contributions from six of its eight components: the percentage of respondents who say they find jobs “hard to get,” the percentage of firms with positions “not able to fill right now,” the number of employees hired by the temporary-help industry, initial claims for unemployment insurance, real manufacturing, and trade sales and industrial production. The two components that contributed positively were job openings and the ratio of involuntarily part-time to all part-time workers.
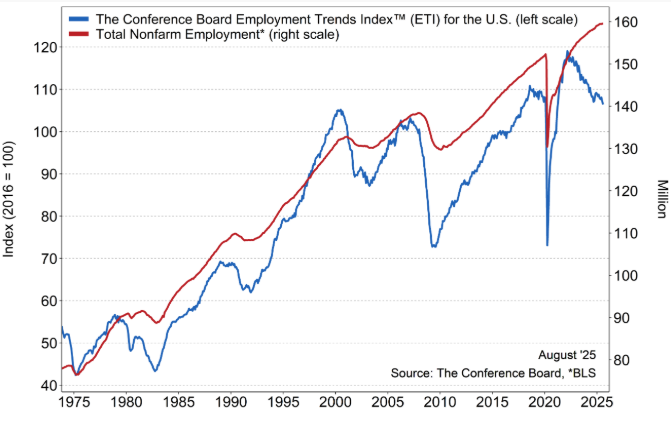
Caption: The Employment Trends Index is a leading composite index for payroll employment. When the Index increases, employment is likely to grow as well, and vice versa. Turning points in the index indicate that a change in the trend of job gains or losses is about to occur in the coming months.
“The ETI slid further in August, reaching its lowest level since early 2021,” says Mitchell Barnes, economist at The Conference Board. “The ETI peaked two or three years ago and has been falling ever since, where the decline likely captured normalization of the distorted post-pandemic labor market, not weakness.
“However, the degree of weakness among August’s components is disconcerting,” he continues.
The share of consumers who report “jobs are hard to get” – an ETI component from the Consumer Confidence Survey – rose to 20% in August compared to 18.9% in July, the highest share since early 2021. In addition, the share of small firms that report jobs are “not able to be filled right now” fell to 32% in August, down from 33% in July and 36% in June. Likewise, the JOLTS job openings fell by 176,000 in July after falling by 355,000 in June – more than offsetting increases in April and May. Employment in the temporary-help industry also decreased, falling by 9,800 in August.
“Layoffs and unemployment remain low as companies navigate through continued uncertainty,” Barnes says. “But tariff pressures are expected to intensify, raising inflation and reducing consumption, which could restrain activity and dampen future hiring.”
According to the Barnes, initial claims for unemployment insurance (an ETI component) ticked up slightly in August. The share of involuntary part-time workers was flat in August, near 17% – below the high of 18% reached in February. Data shows measures of industrial activity in August contributed “the largest negative drag” on the ETI since January. Industrial production fell between June and July, while real manufacturing and trade sales growth slowed to 3.1% year-over-year in June, from a recent high of 4.6% in March.
Barnes says the slowdown corroborates negative manufacturing survey data, including from the Institute for Supply Chain Management, which reported seven consecutive months of manufacturing employment contraction through August.
“While the labor market remained resilient over much of this year, six of eight ETI components were negative in both July and August for the first time since November 2024. This potentially marks a turning point, where business activity is slowing more materially to reflect softer business confidence levels,” he explains.
Important Takeaways, Courtesy of the U.S. Bureau of Labor Statistics:
- Health care added 31,000 jobs, below the average monthly gain of 42,000 over the last 12
months. Employment continued to trend up in ambulatory health care services (+13,000), nursing and residential care facilities (+9,000) and hospitals (+9,000). - Social assistance continued to trend up in August (+16,000), reflecting job growth in individual and family services (+16,000).
- Federal government employment continued to decline in August (-15,000) and is down by 97,000
since reaching a peak in January. (Employees on paid leave or receiving ongoing severance pay are
counted as employed in the establishment survey.)
Click here to review more employment details.


