- KPI – September 2025: The Brief
- KPI – September 2025: State of Manufacturing
- KPI – September 2025: State of Business – Automotive Industry
- KPI – September 2025: State of the Economy
- KPI – September 2025: Recent Vehicle Recalls
Below is a synopsis of consumer confidence, sentiment, demand and income/spending trends.
Sentiment
The University of Michigan Survey of Consumers – a survey consisting of approximately 50 core questions covering consumers’ assessments of their personal financial situation, buying attitudes and overall economic conditions – registered 58.2 in August and posted a preliminary reading of 55.4 in September. Overall, consumer sentiment fell 21% (14.7 points) year-over-year.
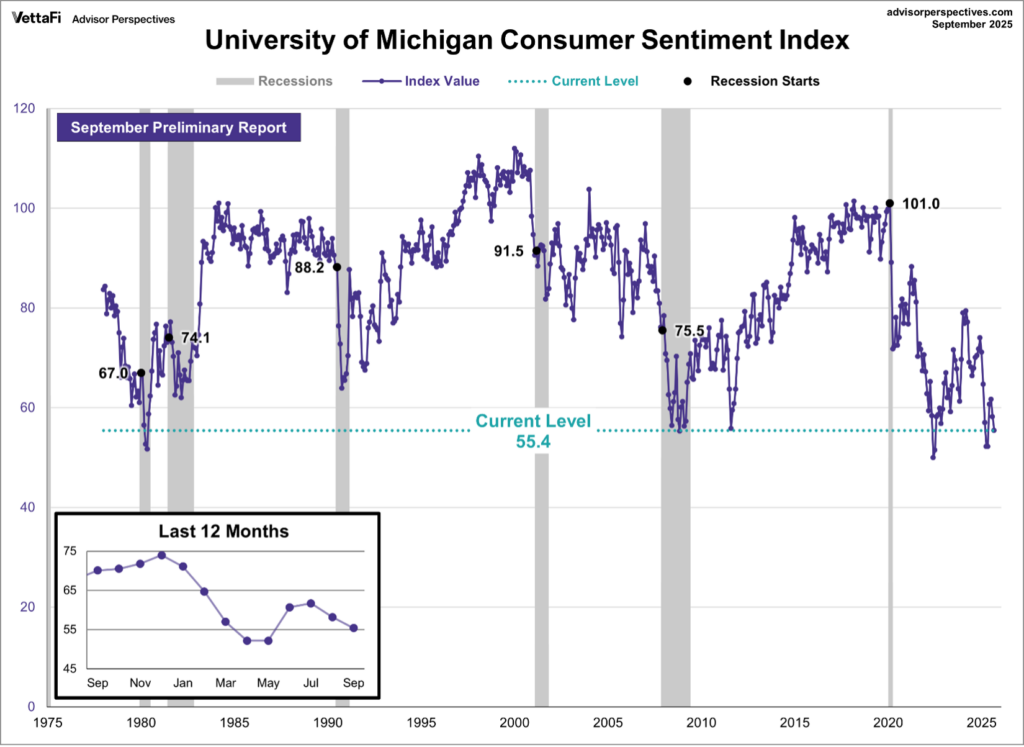
Caption: To put this report in historical context, consumer sentiment is currently 34.3% below its average reading of 84.3 (arithmetic mean) and 33.4% below its geometric mean of 83.1, based on data dating back to 1978. The current index level is at the 1st percentile of the 573 monthly data points in this series.
While buying conditions for durables improved, data shows all other index components fell. According to Joanne Hsu, director of Surveys of Consumers, consumers pointed to multiple vulnerabilities in the economy, including rising risks to business conditions, labor markets and inflation.
“Consumers perceive risks to their wallets as well. Current and expected personal finances both eased approximately 8% this month,” Hsu says. “Trade policy remains highly salient to consumers, with about 60% of consumers providing unprompted comments about tariffs during interviews, little changed from last month.
“Still, sentiment remains above April and May 2025 readings, immediately after the initial announcement of reciprocal tariffs,” she explains.
- Year-ahead inflation expectations held steady at 4.8%, unchanged from August.
- Long-run inflation expectations moved up for the second straight month to 3.9%. This current reading is considerably lower than the 4.4% seen in April.
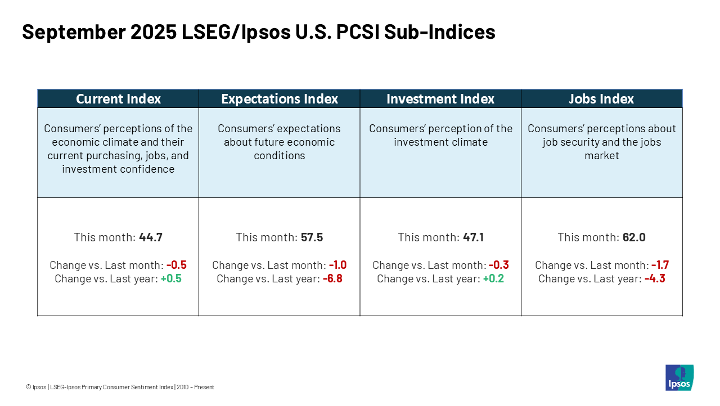
Caption: The LSEG/Ipsos Primary Consumer Sentiment Index (PCSI) for September 2025 is 52.4, down 1.1 points from August and continuing a trend of declining sentiment for American consumers, driven primarily by lower expectations for future economic conditions and a slump in job confidence. This marks a significant reversal from the June rebound and places the index nearly three points lower than its reading from a year ago, suggesting prolonged consumer unease despite current optimism.
Confidence
Similarly, The Conference Board Consumer Confidence Index declined from 98.7 in July (revised up by 1.5 points) to 97.4 (1985 = 100) in August. The Present Situation Index – based on consumers’ assessment of current business and labor market conditions – fell by 1.6 points to 131.2. Meanwhile, the Expectations Index – based on consumers’ short-term outlook for income, business and labor market conditions – decreased by 1.2 points to 74.8. Overall, expectations remained below the threshold of 80, which typically signals a recession ahead.
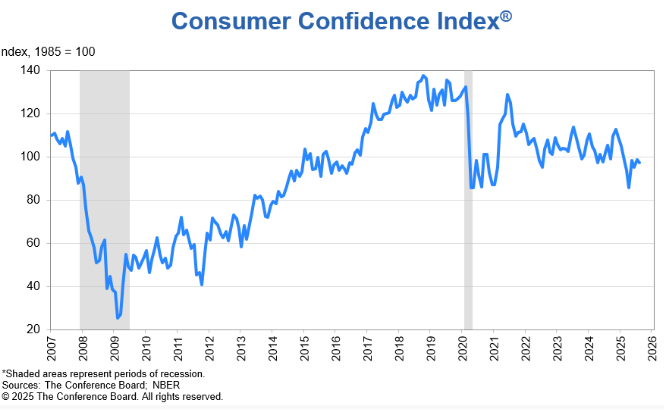
“Consumer confidence dipped slightly in August but remained at a level similar to those of the past three months,” says Stephanie Guichard, senior economist of global indicators at The Conference Board. “The present situation and the expectation components both weakened. Notably, consumers’ appraisal of current job availability declined for the eighth consecutive month, but stronger views of current business conditions mitigated the retreat in the Present Situation Index.
“Meanwhile, pessimism about future job availability inched up and optimism about future income faded slightly. However, these were partly offset by stronger expectations for future business conditions,” she continues.
Confidence decreased among consumers under 35 years old, remained stable for those aged 35-55 and increased for ages 55+. Confidence levels by income group were mixed, with no clear pattern emerging. According to index data, confidence weakened among both Republicans and Democrats but was little changed for Independents.
Key Takeaways, Courtesy of The Conference Board:
- Consumers’ outlook on stock prices deteriorated slightly, with 47.4% of consumers expecting stock prices to increase over the next 12 months, down from 48.9% in July. Conversely, 30.3% of consumers expected stock prices to decrease over the next 12 months, up from 28.1% in July.
- The share of consumers expecting interest rates to rise increased to 54% from 53.1% in July and fewer consumers expected interest rates to fall (20.9% vs 21.4% in July).
- Consumers’ views of their Family’s Current and Future Financial Situations both improved in August.
- The share of consumers expecting a recession over the next 12 months rose to the highest level since April.
- Purchasing plans for cars increased in August, with buying intentions for both used and new cars on the rise. Meanwhile, purchasing plans for homes remained stable after July’s decline. Consumers’ plans to buy big-ticket items were slightly down overall, but with a lot of variation from one item to the next: the strongest increases in buying intentions were for washers and dryers, with the largest declines in TVs and tablets. Consumers’ intentions to purchase more services ahead improved, but the increases were concentrated in a few, mostly non-discretionary categories such as financial services and car and home maintenance. Discretionary spending plans, including dining out and outdoor and indoor entertainment, were down. Vacation intentions fell for a second straight month, with intentions to travel abroad and within the U.S. both declining.
- “Consumers’ write-in responses showed that references to tariffs increased somewhat and continued to be associated with concerns about higher prices. Meanwhile, references to high prices and inflation, including food and groceries, rose again in August,” Guichard says.
As such, consumers’ average 12-month inflation expectations ticked up after three consecutive months of easing, reaching 6.2% in August – up from 5.7% in July but still below the April peak of 7%.
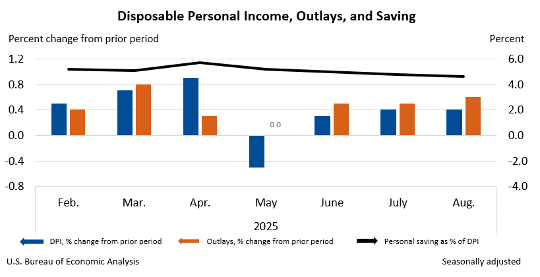
Consumer Income & Spending
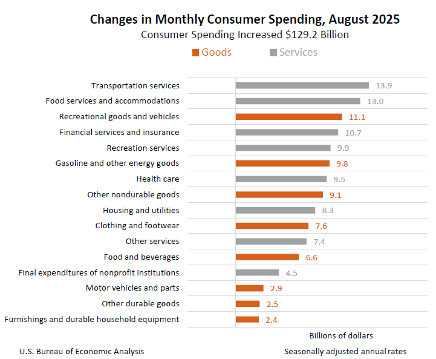
According to the U.S. Bureau of Economic Analysis (BEA), in June personal income increased $95.7 billion (0.4% at a monthly rate), while disposable personal income (DPI) – personal income less personal current taxes – increased $86.1 billion (0.4%) and personal consumption expenditures (PCE) increased $129.2 billion (0.6%).
Personal outlays – the sum of PCE, personal interest payments and personal current transfer payments – increased $132.9 billion in August. Personal saving was $1.06 trillion and the personal saving rate, personal saving as a percentage of disposable personal income, registered 4.6%.
Important Takeaways, Courtesy of BEA:
- In August, the $129.2 billion increase in current-dollar PCE reflected increases of $77.2 billion in spending on services and $52.0 billion in spending on goods.
- Compared to the preceding month, the PCE price index increased 0.3%. Excluding food and energy, the PCE price index increased 0.2%.
- In August, the PCE price index increased 2.7% year-over-year. Excluding food and energy, the PCE price index increased 2.9% from one year ago.