KPI – May 2025: State of Business – Automotive Industry
Sponsored by Holley Performance Brands

- KPI – May 2025: The Brief
- KPI – May 2025: State of Manufacturing
- KPI – May 2025: State of the Economy
- KPI – May 2025: Consumer Trends
- KPI – May 2025: Recent Vehicle Recalls
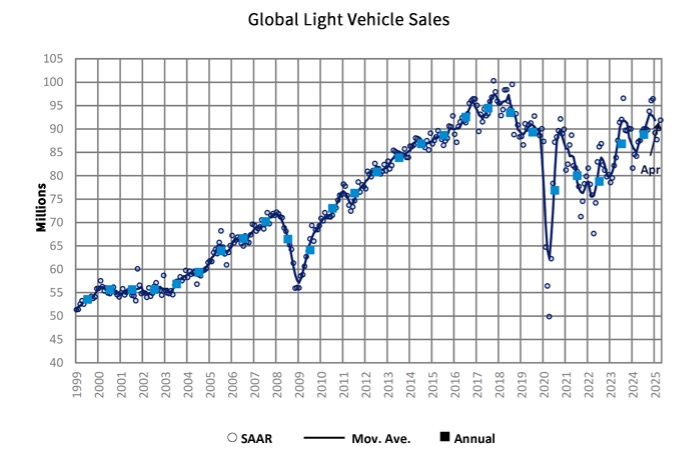
Global Light Vehicle Sales
In April, the Global Light Vehicle (LV) selling rate hit 92 million units per year, up from a downwardly revised 90.4 million units in March. Overall, the market increased 6% (7.3 million units) year-over-year.
Both China and the U.S. posted strong performances. Data shows the “pull-forward effect” stateside is contributing to another impressive sales finish in April. Meanwhile, sales remain stable in China, “buoyed by government stimulus measures.” According to GlobalData, the government extended its vehicle trade-in scrappage incentive until the end of 2025. Doing so boosts the auto market’s domestic demand, specifically for new energy vehicles (NEVs), while also helping to reduce purchase restrictions.
In addition, US-Chinese trade negotiations reached a temporary resolution. Tariff rates were mutually dropped until August 10, offering partial relief to China’s extensive export market.
“Some of the worst fears regarding a global trade war have eased in recent weeks thanks to the announcement of lower tariffs between the United States and China for at least 90 days. Still, there are many potential pitfalls due to the unpredictable nature of U.S. trade policy and economic risks,” says David Oakley, manager of Americas vehicle sales forecasts at GlobalData.
While sales reached 179 thousand units in Canada during April (+7.8% YoY), the selling rate slowed to 1.78 million units per year—down from 2.05 million units per year a month ago, and the lowest recorded rate since August 2024. The Canadian light vehicle landscape was similar to the U.S., with consumers incentivized to buy now rather than wait and face possible price increases.
The light vehicle selling rate in Western Europe rose slightly to 12.8 million units, yet the market was down over 2%. Currently, the region is experiencing stagnant growth in major markets such as Germany and France. Consumer confidence also dropped to its lowest point since November 2023, “highlighting prevailing concerns about the region’s economic outlook,” according to GlobalData.
“May sales are expected to increase 4.6% year-over-year. U.S. sales are likely to see robust growth, as there is still a window—albeit a closing one—for customers to make purchases before the effect of tariffs is reflected in higher pricing,” Oakley says. “China and Japan are both expected to see year-over-year growth, while the economic recovery in Argentina and favorable calendar effects in Brazil should enable an expansion in sales in South America.”
As such, the global selling rate is projected to reach 90.1 million units, up from a rate of 87.6 million units in May 2024.
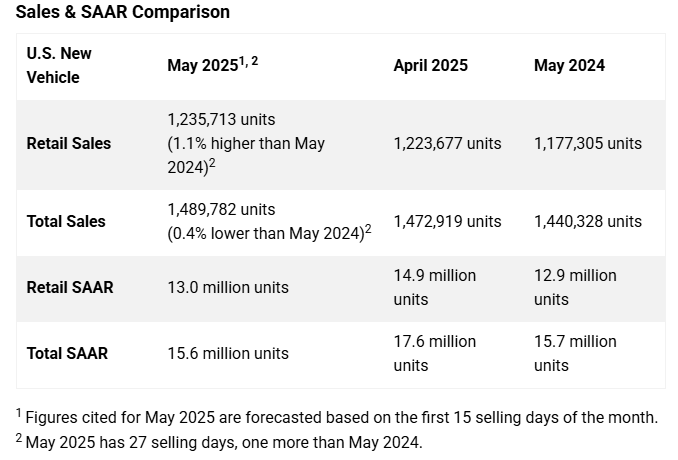
U.S. New Vehicle Market
Total new vehicle sales for May 2025, including retail and non-retail transactions, are projected to reach 1,489,800—flat year-over-year, according to a joint forecast from J.D. Power and GlobalData. May 2025 has 27 selling days, one more than last year. Comparing the same sales volume without adjusting for the number of selling days translates to an increase of 3.4% year-over-year.
“In March and April, approximately 149,000 extra vehicles were sold simply due to buyers re-timing their purchases on the expectation of significant future price increases. These re-timed sales will present a headwind to the industry sales pace for the balance of this year. Despite this effect, retail demand for new vehicles remains robust, with retail sales expected to increase 1.1% over a year ago,” according to Thomas King, president of the data and analytics division at J.D. Power.
Following a surge in vehicle purchases during March and April, he expects May sales to reflect a more tempered market.
“While many May sales were made by shoppers who accelerated their purchases, the sales benefit is being muted by the payback from shoppers who purchased in March and April instead of May,” King continues.
Key takeaways, courtesy of J.D. Power:
- Retail buyers are on pace to spend $53.8 billion on new vehicles, up $3.5 billion year-over-year.
- Internal combustion engine (ICE) vehicles are projected to account for 74.9% of new vehicle retail sales, a decrease of 4.1% from a year ago. Hybrid electric vehicle (HEV) sales are expected to reach 14.8%, an increase of 4.3% during the same timeframe. Plug-in hybrid vehicles (PHEV) are on pace to make up 2.1% of sales, up 0.1% year-over-year, while electric vehicles (EV) are expected to account for 8.1% of sales, down 0.4%.
- Trucks/SUVs are on pace to account for 81.9% of new vehicle retail sales, up 1.8% year-over-year.
- Leasing is estimated to account for 20.7% of sales in May, down 3.3% from a year ago.
- Fleet sales are expected to total 254,069 units this month, down 7% year-over-year. Fleet volume is projected to account for 17.1% of total light-vehicle sales, down 1.2% from a year ago.
- The average new vehicle retail transaction price is projected to reach $45,462, up $649 year-over-year.
- Average incentive spending per unit is expected to fall to $2,536, down $143 year-over-year.
- Average monthly finance payments are on pace to hit $748, up $21 year-over-year. The average interest rate for new-vehicle loans is estimated to be 6.93%, down 0.10% from a year ago.
- Total retailer profit per unit, which includes vehicle gross plus finance and insurance income, is expected to be $2,502, up $98 year-over-year but down $29 from April. Total aggregate retailer profit from new-vehicle sales for this month is projected to be $3 billion, up 9.8% year-over-year.
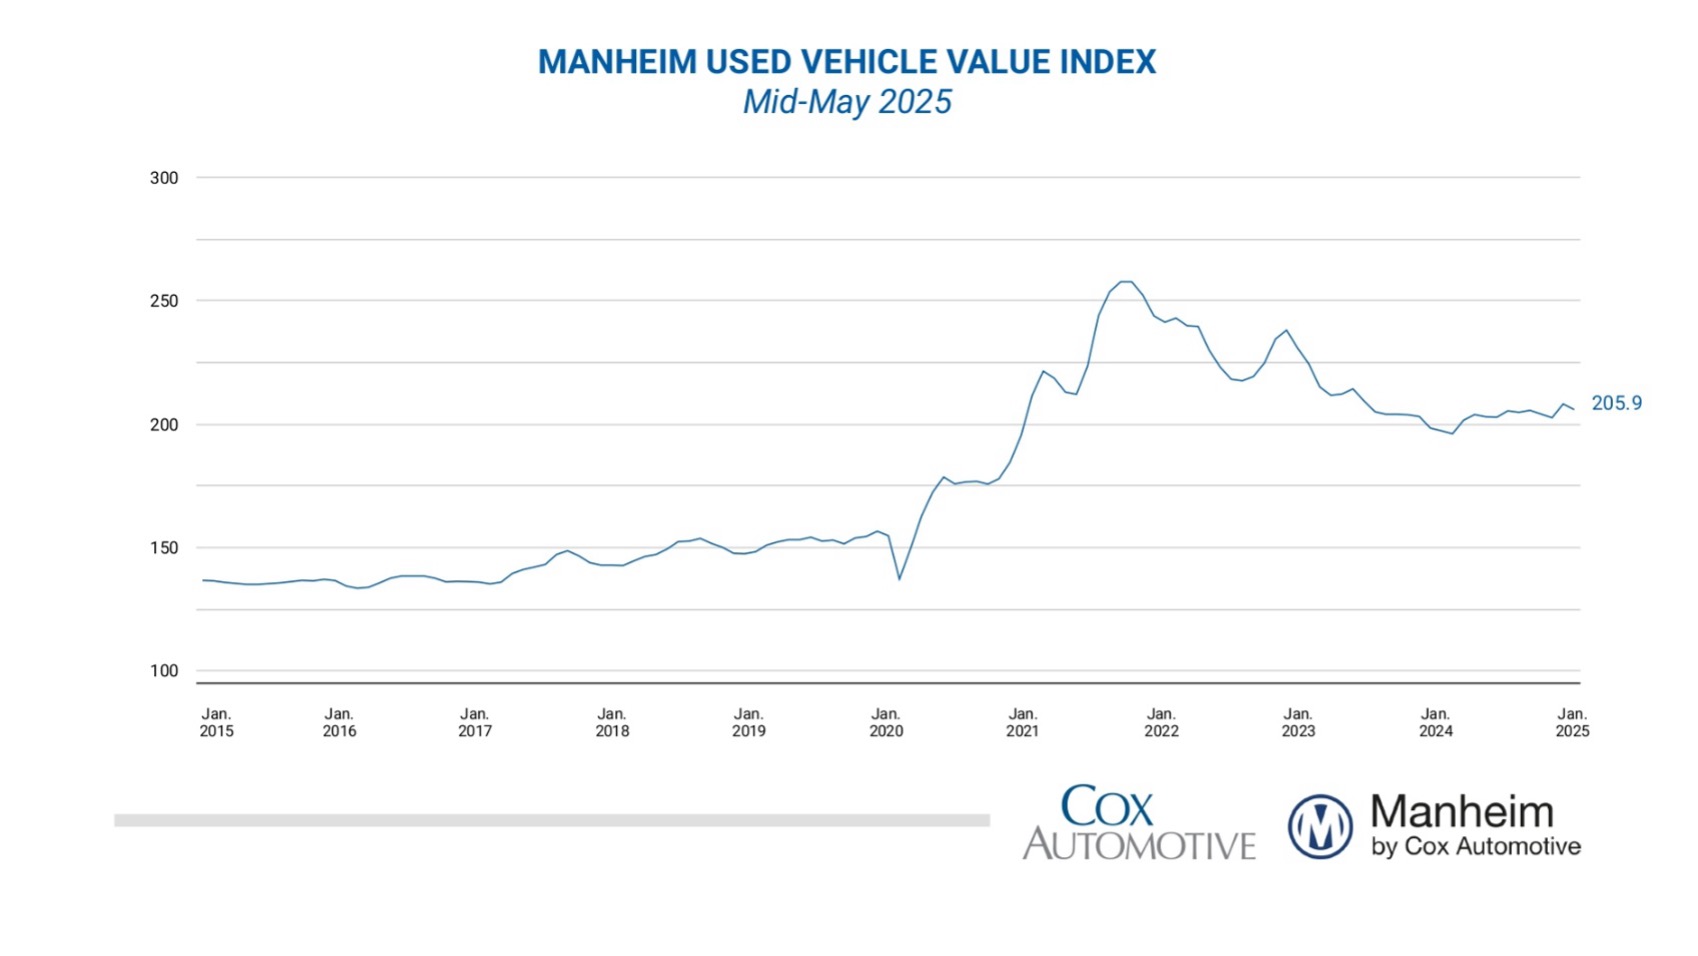
U.S. Used Market
Wholesale used-vehicle prices (on a mix-, mileage- and seasonally-adjusted basis) declined during the first 15 days of May. The mid-month Manheim Used Vehicle Value Index fell to 205.9, showing a rise of 4.4% from the full month of May 2024.
“April was a very strong month for wholesale price appreciation, but the gains decelerated each week over the course of the month, and that trend continued into early May,” says Jeremy Robb, senior director of economic and industry insights at Cox Automotive. “In the first two weeks of May, we’ve seen fairly normal depreciation trends on a weekly basis, as used retail supply remains constrained. However, some of the strength in the pace of used sales has backed off and days’ supply is getting slightly better.”
“As the tariff situation evolves and the frenzy of buying activity for new vehicles calms down, we expect wholesale pricing trends to remain more normal through Q2,” he continues.
According to Manheim, most major market segments posted positive results for seasonally-adjusted prices year-over-year during the first half of May. When compared to the industry’s 4.4% year-over-year increase, the luxury segment performed best (+6.6%), with SUVs a close second (+5.5%). Midsize cars and trucks were up 2.3% and 0.5%, respectively, while compact cars dipped 1.2%. Electric vehicles (EVs) secured a 2% year-over-year increase.
Month-over-month results were relatively poor, with midsize cars, luxury, SUVs, trucks and compact cars down 0.5%, 0.7%, 1%, 1.7% and 1.9%, respectively. EVs declined 2% during the first half of May, while non-EVs were down 1.5%.
According to King at JD Power, 24.4% of trade-ins are expected to carry negative equity this month—an increase of 0.5% year-over-year.