
- KPI – March 2025: The Brief
- KPI – March 2025: Recent Vehicle Recalls
- KPI – March 2025: State of Business – Automotive Industry
- KPI – March 2025: State of Manufacturing
- KPI – March 2025: Consumer Trends
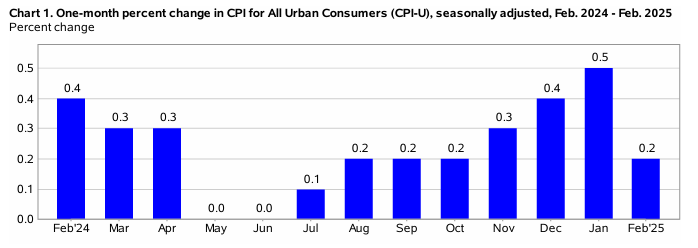
In February, the Consumer Price Index for All Urban Consumers (CPI-U) increased 0.2% on a seasonally adjusted basis following a 0.5% increase in January. Over the last 12 months, the all-items index increased 2.8% before seasonal adjustment.
Important takeaways, courtesy of the U.S. Bureau of Labor Statistics:
- The index for shelter rose 0.3%, accounting for nearly half of the monthly all-items increase. An uptick in shelter was partially offset by a 4% decrease in airline fares and a 1% decline in the gasoline index. Despite a decrease in gasoline, the energy index rose 0.2% month-over-month as the indexes for electricity and natural gas increased. The index for food also edged up in February, rising 0.2% as food-away-from-home increased 0.4%.
- Indexes on the rise month-over-month include medical care, used cars and trucks, household furnishings and operations, recreation, apparel and personal care. Airline fares and new vehicles were among the few major indexes to decrease in February.
- The all-items index rose 2.8% year-over-year, after rising 3% in January. The all-items-less-food-and-energy index jumped 3.1% over the last 12 months. The energy index decreased 0.2%, while the food index increased 2.6% over the last year.
Caption: According to the U.S. Department of Agriculture (USDA) Economic Research Service, grocery (food-at-home) prices have grown 2.6% per year on average over the last 20 years (2005–2024). In 2025, however, grocery prices are expected to increase by 3.3%, outpacing this historic average.
Employment
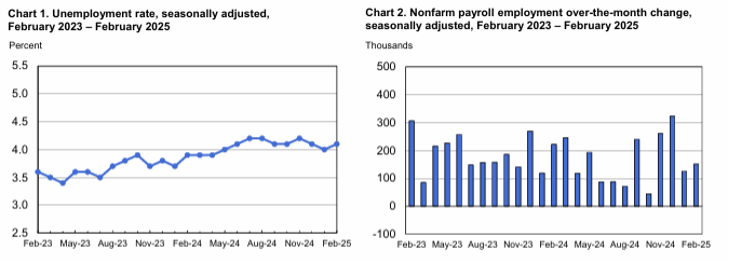
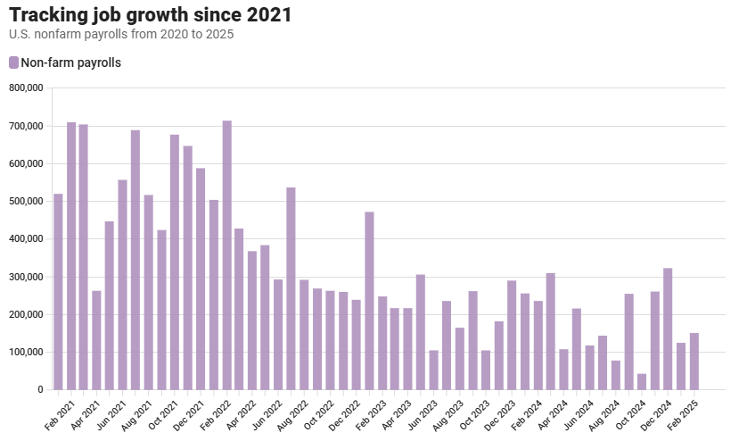
Total nonfarm payroll employment rose by 151,000 in February – slightly below estimates of 160,000 to 170,000.
Job growth was concentrated in health care (52,000), financial activities (21,000), transportation and warehousing (18,000), as well as social assistance (11,000). The unemployment rate and number of unemployed persons edged up to 4.1% and 7.1 million, respectively.
According to the U.S. Bureau of Labor Statistics, the labor force participation and long-term unemployed (those jobless for 27 weeks or more) rates were relatively unchanged at 62.4% and 20.9%, respectively. While the number of discouraged workers – a subset of the marginally attached who believed that no jobs were available for them – decreased by 128,000 to 464,000 in February, the number of people employed part time for economic reasons increased by 460,000 to 4.9 million during the same timeframe.
“The Fed is in a pickle,” says Bill Adams, chief economist for Comerica Bank. “On the one hand, slower job growth and rising unemployment are arguments for a rate cut. On the other hand, inflationary policies like tariffs and immigration restrictions are arguments against a cut.”
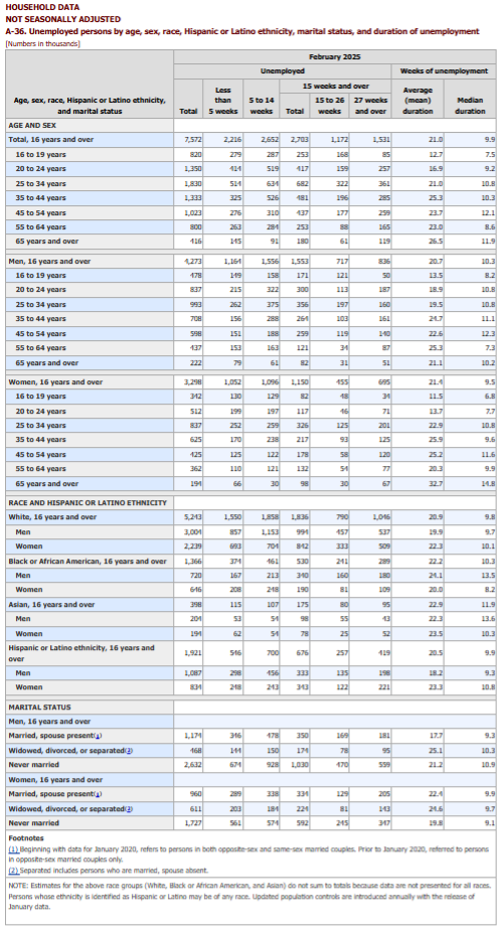
By Demographic
This month, unemployment rates among the major worker groups were: adult women – 3.8%; adult men – 3.8%; teenagers – 12.9%; Asians – 3.2%; Whites – 3.8%; Hispanics – 5.2%; and Blacks – 6%.
Last month, unemployment rates among the major worker groups were: adult women – 3.7%; adult men – 3.7%; teenagers – 11.8%; Asians – 3.7%; Whites – 3.5%; Hispanics – 4.8%; and Blacks – 6.2%.
Source: U.S. Bureau of Labor Statistics data
By Industry
The Conference Board Employment Trends Index (ETI) declined in February to 108.56, from an upwardly revised 109.45 in January. For context, the current reading mirrors last month before it was upwardly revised by more than 1 point – putting the data in line with October, November and December 2024 at 108.25, 109.45 and 109.23, respectively.
“Growing policy uncertainty is beginning to weigh on business and consumer sentiment, with more substantial impacts from federal layoffs and funding disruptions expected in the months ahead,” says Mitchell Barnes, economist at The Conference Board.
For example, data shows the number of consumers who report “jobs are hard to get” inched up 1.8 percentage points in February. Likewise, the share of small firms reporting jobs are “not able to be filled right now” rose from 35% to 38% – its largest monthly increase in nearly a year.
These trends, Barnes says, reflect modest declines in perceived labor market strength despite measures of economic activity remaining stable, including Real Manufacturing and Trade Sales and Industrial Production.
Though recently announced federal and private-sector layoffs were not fully captured in the recent ETI, Barnes points to several components that show “potential early-warning signs of wavering conditions.” He cites initial claims for unemployment insurance as an example – up 3.4% in February. In addition, the share of involuntary part-time workers rose from 16.7% in January to 18% in February, its highest level since 2021. Employment in the temporary-help industry also declined, with job losses totaling 22,000 across January and February.
While the jobs market remains healthy overall, he believes risks of a slowdown in the hiring environment are emerging.
“Uncertainty is likely to make employers more cautious and, if prolonged, could portend more pronounced labor market weakness in the coming months. Despite a resilient end to 2024, momentum in the U.S. labor market is clearly at risk of fading,” Barnes says.
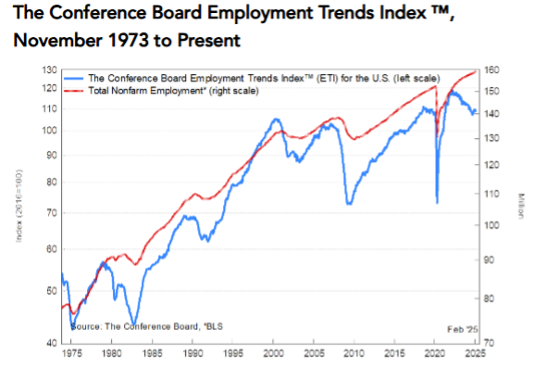
Caption: The Employment Trends Index is a leading composite index for payroll employment. When the Index increases, employment is likely to grow as well, and vice versa. Turning points in the Index indicate that a change in the trend of job gains or losses is about to occur in the coming months.
Important takeaways, courtesy of the U.S. Bureau of Labor Statistics:
- Health care added 52,000 jobs in February, in line with the average monthly gain of 54,000 over the prior 12 months. Job growth continued in ambulatory health care services (+26,000), hospitals (+15,000), as well as nursing and residential care facilities (+12,000).
- Employment in financial activities rose by 21,000, above the prior 12-month average gain (+5,000). Employment continued to trend up in real estate and rental and leasing (+10,000), plus insurance carriers and related activities (+5,000). Commercial banking lost 5,000 jobs.
- Transportation and warehousing employment continued to trend up (+18,000), in line with the average monthly gain over the prior 12 months (+13,000). Job growth occurred in couriers and messengers (+24,000) and air transportation (+4,000).
- Employment in social assistance was up (+11,000), below the average monthly gain over the prior 12 months (+21,000). Employment continued to trend up in individual and family services (+10,000).
- Within government, federal government employment declined by 10,000.
Click here to review more employment details.


