KPI – March 2025: State of Business – Automotive Industry
Sponsored by Holley Performance Brands

- KPI – March 2025: The Brief
- KPI – March 2025: State of Manufacturing
- KPI – March 2025: Consumer Trends
- KPI – March 2025: State of the Economy
- KPI – March 2025: Recent Vehicle Recalls
Global Light Vehicle Sales
In January, the Global Light Vehicle (LV) selling rate registered 89 million units per year. Data shows market volumes increased 2% – or 6.8 million units – on a year-over-year basis.
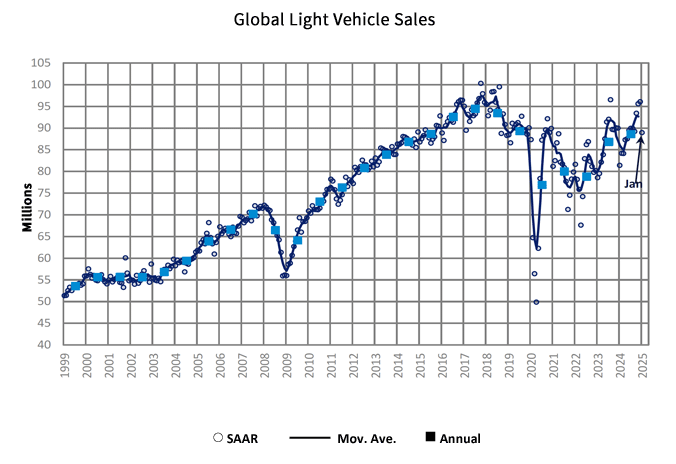
In particular, the U.S. market improved despite economic uncertainty associated with pending tariffs. In China, sales declined slightly, as extension of the scrapping subsidies was unavailable to half the country’s provinces before the Lunar New Year. Likewise, Western Europe dipped as a result of increasing political and economic headwinds; however, BEV sales posted a solid improvement, according to GlobalData.
Looking ahead, February is expected to increase 7% compared to last year, with an estimated selling rate of 86 to 88 million units – approximately 2 to 3 million units above last year’s selling rate. Total U.S. vehicle sales, for example, are estimated to hit 15.80 million by the end of the quarter, according to Trading Economics.
“Despite the high level of uncertainty, including the potential for a global trade war, vehicle sales are showing resilience. The forecast for the year remains 91.6 million units, representing an increase of nearly 4% from 2024. We remain cautiously optimistic yet realistic about the health of the global auto market, as there are significant variables from trade risks to economic pressures that could affect the trajectory of sales in the near term,” says Jeff Schuster, vice president of automotive research at GlobalData.
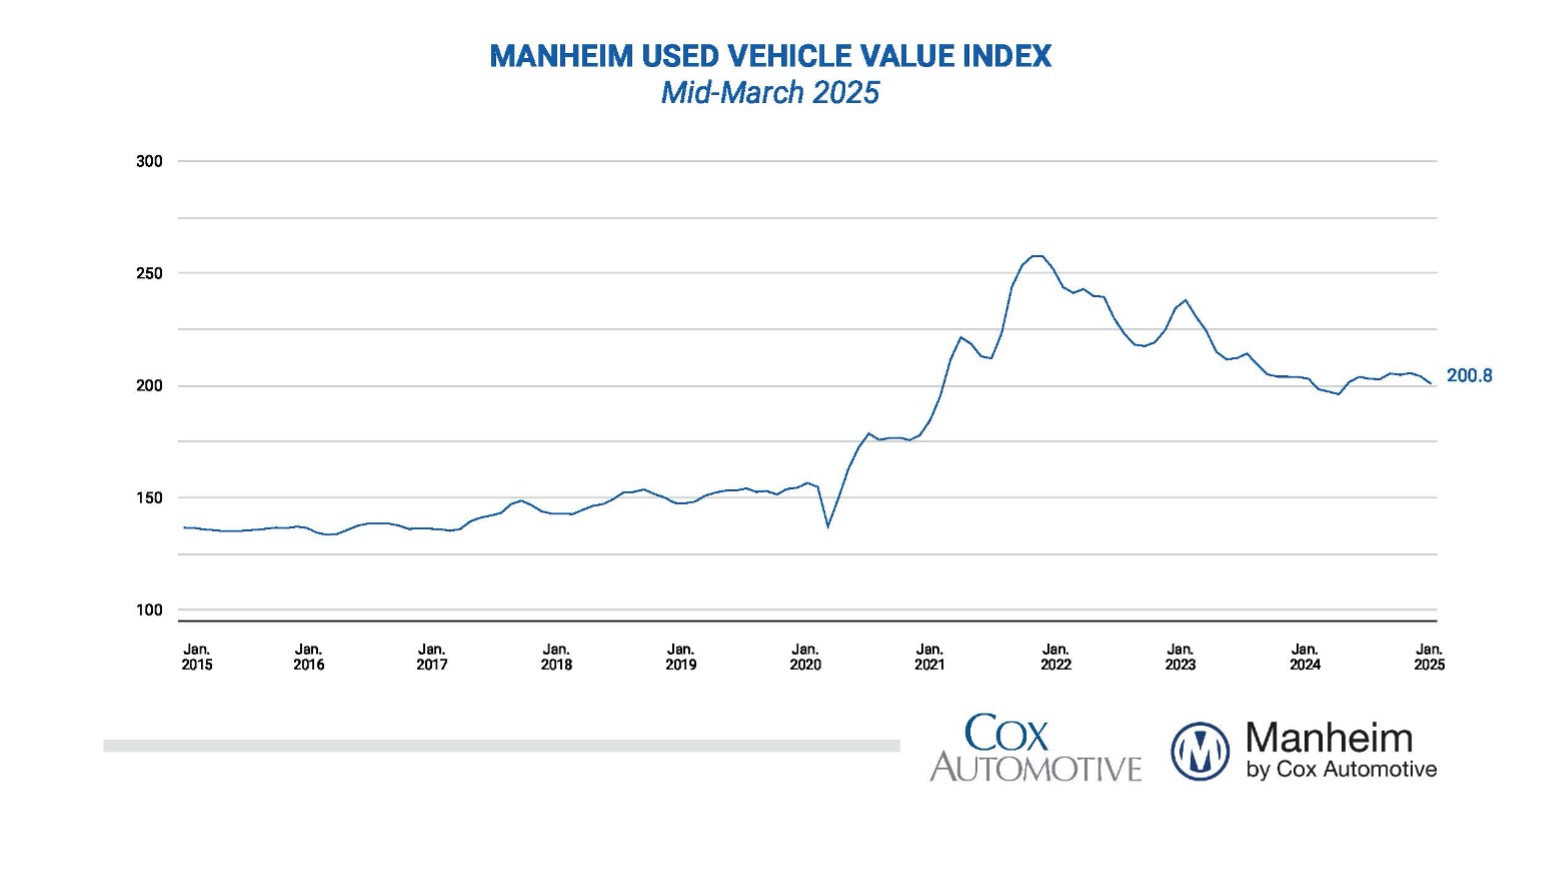
U.S. Used Market
Wholesale used-vehicle prices (on a mix-, mileage- and seasonally adjusted basis) decreased during the first 15 days of March. The mid-month Manheim Used Vehicle Value Index fell to 200.8, posting a decline of 1.1% from the full month of March 2024.
“In the first half of March, we have seen exactly half of the rise in vehicle appreciation that we typically see for the full month,” says Jeremy Robb, senior director of economic and industry insights at Cox Automotive. “Prices are higher, but up less than expected, likely due to an older vehicle mix as lease maturities decline. While full March results are a few weeks away, we are now at the time when we typically see the strongest weekly gains for wholesale prices – our ‘Spring Bounce.’ Tax refund season is well underway, and consumers are getting more money in their pockets; used retail days’ supply is tight. But there’s no question that tariff talk is spooking some consumers, and we may have already seen the peak in the wholesale market.”
According to Manheim, most major market segments posted negative results for seasonally adjusted prices year-over-year during the first half of March. Compared to the industry’s year-over-year decrease of 1.1%, luxury was up 0.2%, while SUVs, pickups, as well as mid-size and compact cars were down 0.8%, 1.2%, 4.9% and 6.6%, respectively. EVs were down 4.9% year-over-year, while the non-EV segment dipped 1.3%.
On a month-over-month basis, the overall industry slid into decline, with luxury, SUVs, pickups, plus mid-size and compact cars decreasing 0.5%, 0.9%, 1.2%, 1.8% and 1.2%, respectively. EVs decreased by 4% in the first half of March compared to February values, while non-EVs were down only 0.8% in the month.


