- KPI – February 2025: The Brief
- KPI – February 2025: State of Manufacturing
- KPI – February 2025: State of Business – Automotive Industry
- KPI – February 2025: State of the Economy
- KPI – February 2025: Recent Vehicle Recalls
Below is a synopsis of consumer confidence, sentiment, demand and income/spending trends.
The University of Michigan Survey of Consumers – a survey consisting of approximately 50 core questions covering consumers’ assessments of their personal financial situations, buying attitudes and overall economic conditions – registered 71.1 in January and posted a preliminary reading of 67.8 in February.
“Consumer sentiment fell for the second straight month, dropping about 5% to reach its lowest reading since July 2024,” according to Joanne Hsu, survey director. “The decrease was pervasive, with Republicans, Independents and Democrats all posting sentiment declines from January, along with consumers across age and wealth groups.”
Furthermore, she says all five index components deteriorated this month – led by a 12% drop in buying conditions for durables, which is linked, at least in part, to the perceived negative impact of current tariff policy.
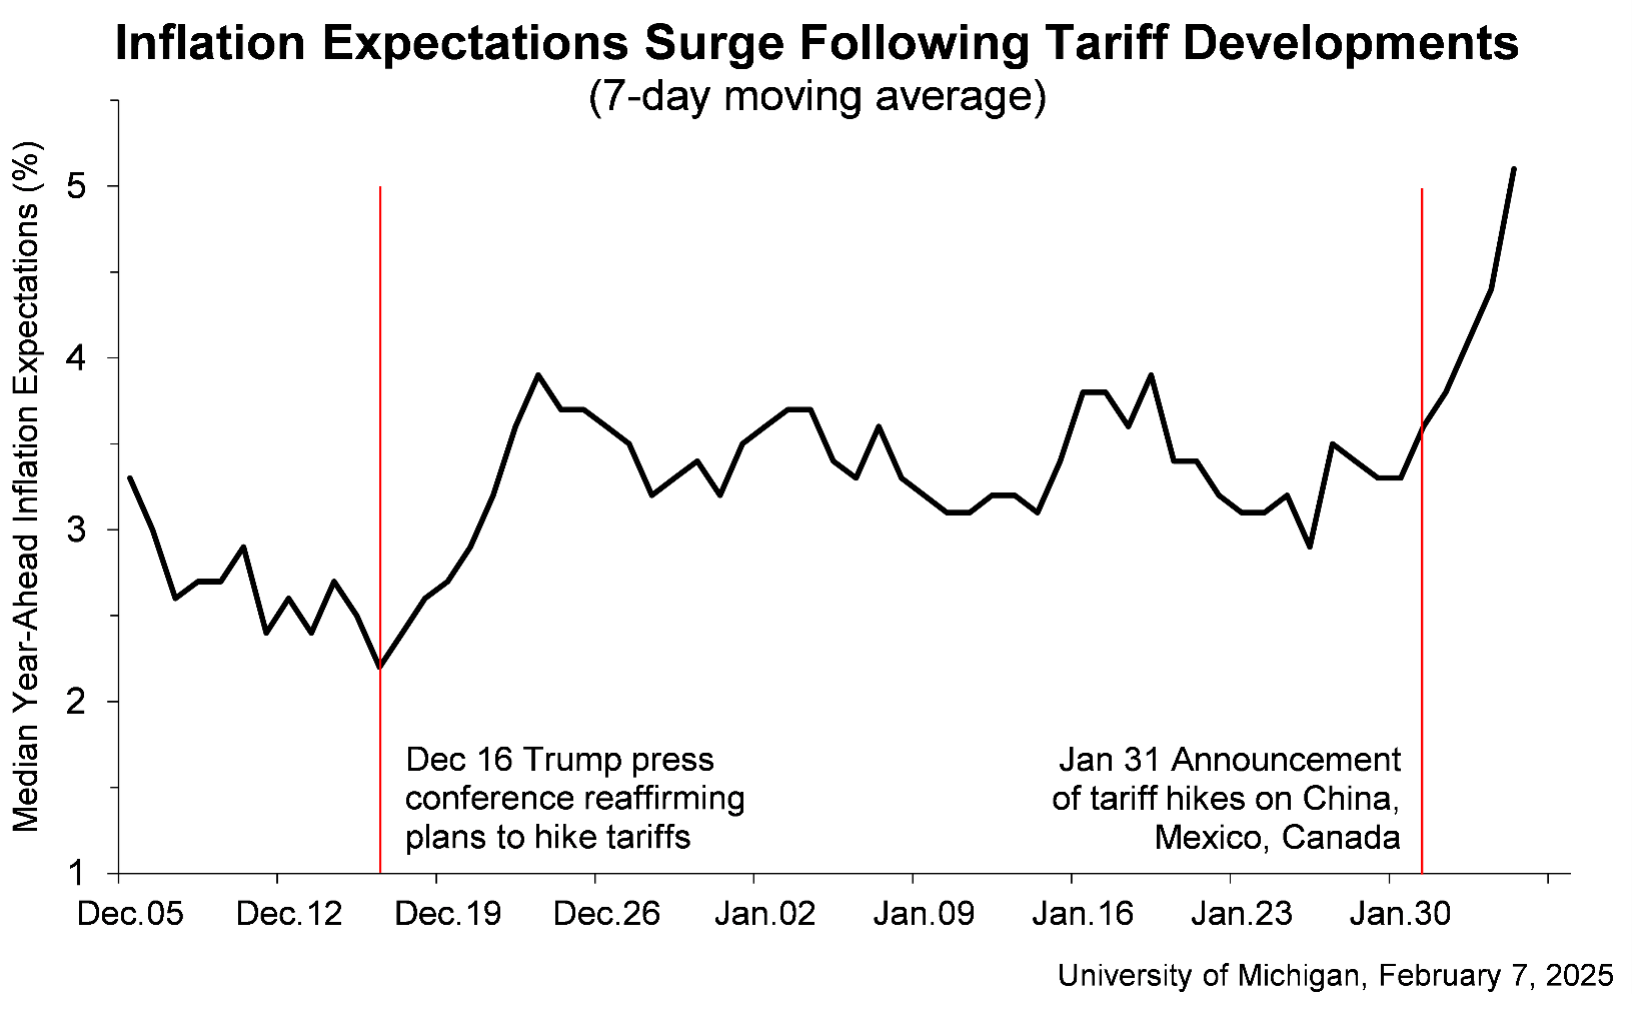
Data shows expectations for personal finances also dipped nearly 6% compared to last month – the lowest value since October 2023. Looking ahead, inflation expectations increased from 3.3% last month to 4.3% this month, the second consecutive month of unusually large increases and the highest reading since November 2023.
“This is only the fifth time in 14 years we have seen such a large one-month rise (1 percentage point or more) in year-ahead inflation expectations,” Hsu explains, noting the reading is currently well above the 2.3%-3.0% range seen in the two years prior to the pandemic.
Likewise, long-run inflation expectations ticked up from 3.2% last month to 3.3% this month, which remains elevated relative to the 2.2%-2.6% range seen in the two years pre-pandemic.
“Many consumers appear worried that high inflation will return within the next year,” she says.
Similarly, The Conference Board Consumer Confidence Index declined from an upwardly revised 109.5 in December to 104.1 in January. The Present Situation Index – based on consumers’ assessment of current business and labor market conditions – fell sharply in January, dropping 9.7 points to 134.3. Meanwhile, the Expectations Index – based on consumers’ short-term outlook for income, business and labor market conditions – declined 2.6 points to 83.9 (above the threshold of 80, which historically signals recessionary trends).
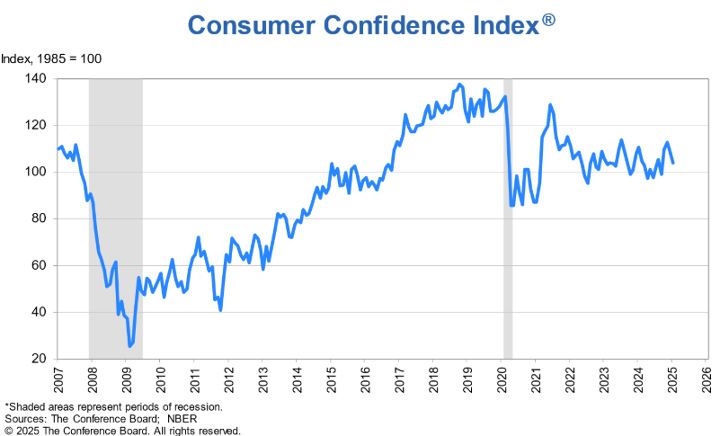
“Consumer confidence has been moving sideways in a relatively stable, narrow range since 2022. January was no exception. The Index weakened for a second straight month but still remained in that range – even if in the lower part,” says Dana M. Peterson, chief economist at The Conference Board.
While all five components of the index deteriorated, data shows consumers’ assessments of the present situation posted the largest decline. In particular, views associated with current labor market conditions fell for the first time since September, and assessments of business conditions weakened for the second month in a row. According to Peterson, consumers were less optimistic about future business conditions and, to a lesser extent, income.
“The return of pessimism about future employment prospects seen in December was confirmed in January,” she says.
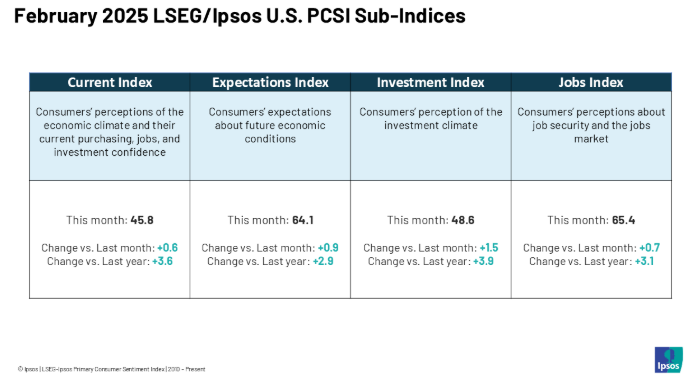
Caption: Survey of Consumers and Conference Board data is seemingly in analytical conflict with monthly consumer data published by the LSEG/Ipsos Primary Consumer Sentiment Index (PCSI), Employment Trends Index (ETI), Fiserv Small Business Index and the NFIB Small Business Index, all of which were either largely optimistic or indicative of “normalization” within labor markets. The discrepancy can be influenced by survey sample, index indictors, timing, etc. Readers are encouraged to review all data sources for a comprehensive representation.
The most recent decline in confidence was led by consumers under 55 years old and among households earning over $125,000. Conversely, those aged 55-plus posted a small uptick, while consumers at the bottom of the income range reported the strongest gains. The confidence gap between the top income groups and those making between $75,000 and $100,000 narrowed.
“Nonetheless, there were positive notes in other aspects of the survey,” Peterson says. “Consumers’ views of their family’s current financial situation were more positive, and six-month expectations for family finances reached a new series high. The proportion of consumers anticipating a recession over the next 12 months was stable near the series low.”
In addition, data shows consumers remained bullish about the stock market. More than half of consumers (52.9%) expected stock prices to increase over the year ahead, compared to 23.7% who expected stock prices to decline.
CONSUMER INCOME & SPENDING
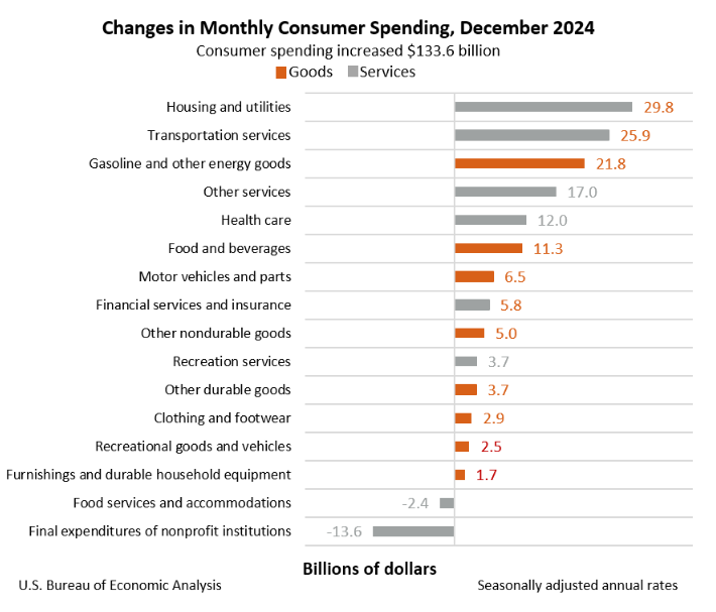
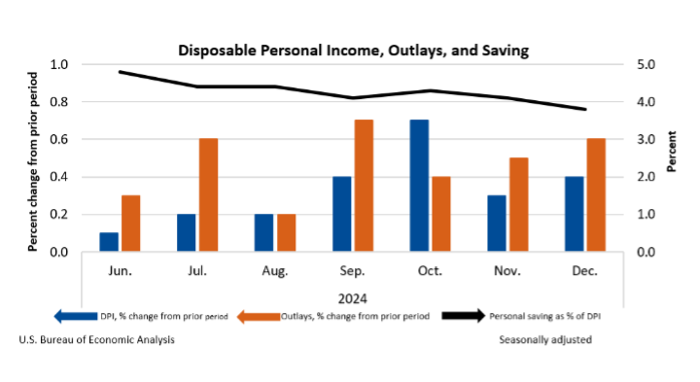
According to the U.S. Bureau of Economic Analysis (BEA), in December 2024 personal income increased $92 billion (0.4% at a monthly rate). Disposable personal income (DPI) – personal income less personal current taxes – increased $79.7 billion (0.4%), while personal consumption expenditures (PCE) increased $133.6 billion (0.7%).
Personal outlays – the sum of personal consumption expenditures, personal interest payments and personal current transfer payments – increased $129.5 billion in December. Personal saving was $843.2 billion and the personal saving rate – personal saving as a percentage of disposable personal income – registered 3.8%.
Important takeaways, courtesy of BEA:
- In December, the $133.6 billion increase in current-dollar PCE reflected an increase of $78.2 billion in spending for services and $55.4 billion in spending for goods.
- The PCE price index increased 0.3% month over month and 2.6% year over year.