KPI – November 2024: The Brief
KPI – November 2024: State of Manufacturing
KPI – November 2024: State of Business – Automotive Industry
KPI – November 2024: State of the Economy
KPI – November 2024: Recent Vehicle Recalls
Below is a synopsis of consumer confidence, sentiment, demand and income/spending trends.
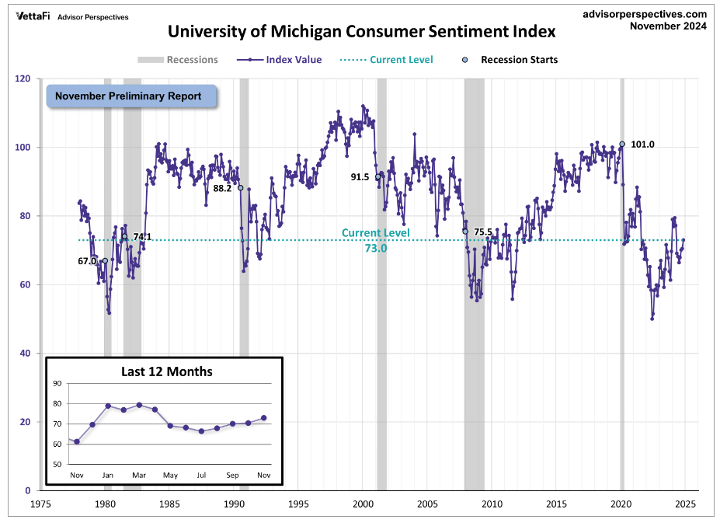
The University of Michigan Survey of Consumers is a survey consisting of approximately 50 core questions covering consumers’ assessments of their personal financial situation, buying attitudes and overall economic conditions.
The Survey of Consumers registered 70.1 in September and finished at 70.5 in October. The preliminary reading for November is 73.0—its highest reading in six months.

“While current conditions were little changed, the expectations index surged across all dimensions, reaching its highest reading since July 2021. Expectations over personal finances climbed 6% in part due to strengthening income prospects, and short-run business conditions soared 9% in November,” says Joanne Hsu, director of Survey of Consumers. “Meanwhile, long-run business conditions increased to its most favorable reading in nearly four years. Sentiment is now nearly 50% above its June 2022 trough but remains below pre-pandemic readings.”
Takeaways, courtesy of Survey of Consumers:
- Year-ahead inflation expectations fell slightly from 2.7% last month to 2.6% this month. The current reading is the lowest since December 2020 and sits within the 2.3%-3.0% range seen in the two years prior to the pandemic.
- Long-run inflation expectations inched up from 3.0% last month to 3.1% this month, remaining modestly elevated relative to the range of readings seen in the two years pre-pandemic.
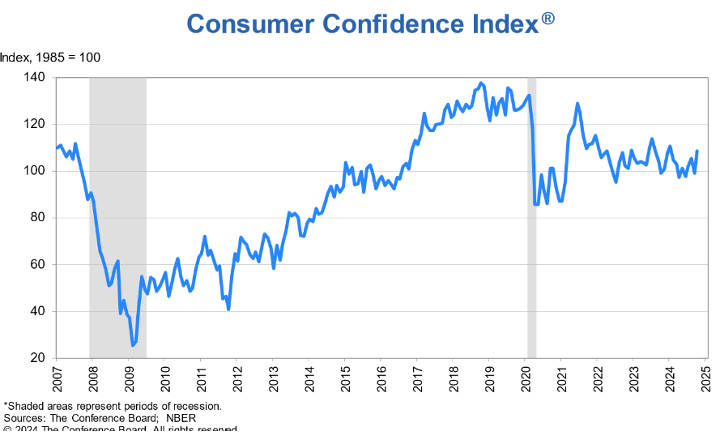
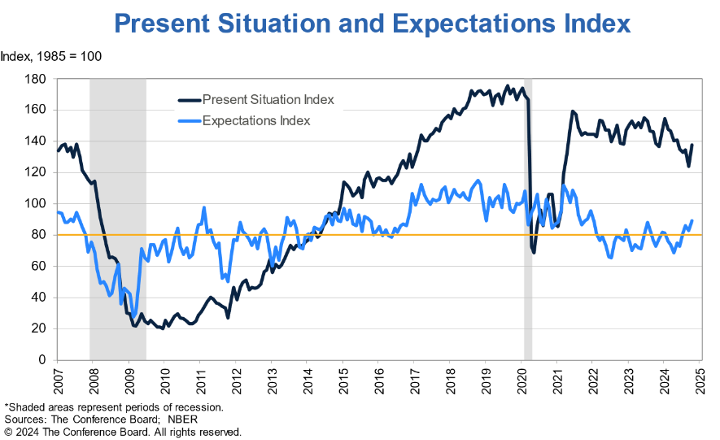
Likewise, the Conference Board Consumer Confidence Index increased from 99.2 in September to 108.7 (1985=100) in October. The Present Situation Index—based on consumers’ assessment of current business and labor market conditions—increased by 14.2 points to 138.0. Meanwhile, the Expectations Index—based on consumers’ short-term outlook for income, business and labor market conditions—increased by 6.3 points to 89.1, well above the threshold of 80 that usually signals a recession ahead.

“Consumer confidence recorded the strongest monthly gain since March 2021, but still did not break free of the narrow range that has prevailed over the past two years,” says Dana M. Peterson, chief economist at The Conference Board.
She says all five components of the Index improved, including consumers’ assessments of current business conditions. Views on the current availability of jobs rebounded after several months of weakness, potentially reflecting better labor market data.
“Compared to last month, consumers were substantially more optimistic about future business conditions and remained positive about future income. Also, for the first time since July 2023, they showed some cautious optimism about future job availability,” Peterson says.
October’s boost in confidence was broad-based across all age and most income groups. Confidence rose sharpest for consumers aged 35 to 54. On a six-month moving average basis, householders aged under 35 and those earning over $100,000 remained the most confident.
“The proportion of consumers anticipating a recession over the next 12 months dropped to its lowest level since the question was first asked in July 2022, as did the percentage of consumers believing the economy was already in recession. Consumers’ assessments of their Family’s Current Financial Situation were unchanged, but optimism for the next six months reached a series high,” she explains.
For example, purchasing plans for homes and new cars increased on a six-month moving average basis. When asked about plans to buy more durable goods or services over the next six months, consumers expressed “a slightly greater preference” for purchasing goods. Their buying plans for big-ticket appliances were mixed, while buying plans for electronics were slightly down. Regarding services, consumers’ priorities were little changed, but they were keen to spend a bit more on some discretionary items going forward. Plans to dine out and stay in hotels jumped in October. Likewise, plans to enjoy entertainment outside of the home, including museums and amusement parks, ticked up as well.
That said, despite further slowing in overall inflation and declines in gas prices, Peterson notes average 12-month inflation expectations rose from 5.2% last month to 5.3% in October.
“This may reflect continued upward pressures on food and service prices. Still, inflation expectations were well below the peak of 7.9% in March 2022. Mentions of prices and inflation continued to top write-in responses as topics affecting consumers’ views of the economy,” she explains.

CONSUMER INCOME & SPENDING
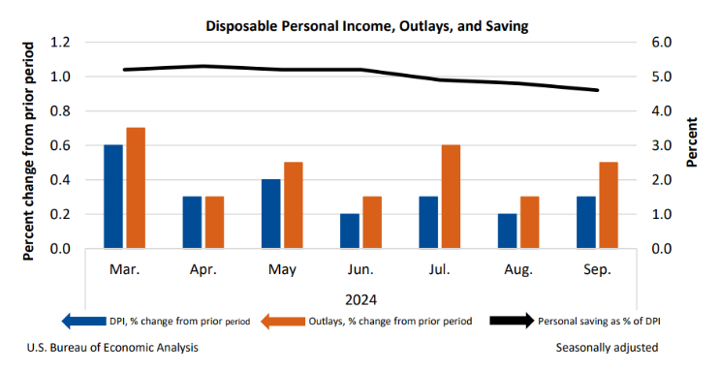
According to the U.S. Bureau of Economic Analysis (BEA), in September 2024 personal income increased $71.6 billion (0.3% at a monthly rate). Disposable personal income (DPI)—personal income less personal current taxes—increased $57.4 billion (0.3%).
Personal outlays—the sum of personal consumption expenditures, personal interest payments and personal current transfer payments—increased $106.3 billion (0.5%) and consumer spending increased $105.8 billion (0.5%). Personal saving was $1.00 trillion and the personal saving rate—personal saving as a percentage of disposable personal income—registered 4.6% in September.

Important takeaways, courtesy of BEA:
- In September, the $105.8 billion increase in consumer spending reflected an increase in spending for both services and goods. Within services, the largest contributors to the increase were healthcare and housing. Within goods, the largest contributors to the increase were other non-durable goods (led by prescription drugs), food and beverages and new motor vehicles (led by light trucks). According to market data, these increases were partly offset by a decrease in motor vehicle fuels, lubricants and fluids.
- Overall, the PCE price index increased 2.1% year-over-year. Prices for goods decreased 1.2%, while prices for services increased 3.7%. Food prices increased 1.2%, but energy prices decreased 8.1%. Excluding food and energy, the PCE price index increased 2.7% from one year ago.


