KPI — September 2021: Consumer Trends
The Conference Board Consumer Confidence Index® declined in August, following a decrease in July (a downward revision). The Index now stands at 113.8 (1985=100), down from 125.1 a month prior. The Present Situation Index – based on consumers’ assessment of current business and labor market conditions – fell to 147.3 from 157.2 last month. The Expectations Index – based on consumers’ short-term outlook for income, business and labor market conditions – dropped to 91.4 from 103.8.
“Consumer confidence retreated in August to its lowest level since February 2021 (95.2),” said Lynn Franco, senior director of economic indicators at The Conference Board. “Concerns about the Delta variant – and, to a lesser degree, rising gas and food prices – resulted in a less favorable view of current economic conditions and short-term growth prospects.”
While a resurgence of COVID-19 and mounting inflation have impacted confidence, it is too soon to tell if this decline will result in consumers significantly curtailing their spending in the months ahead, noted Franco.
Likewise, The Consumer Sentiment Index – a survey consisting of approximately 50 core questions covering consumers’ assessments of their personal financial situation, buying attitudes and overall economic conditions – fell to 70.3 in August. The month-over-month decline of 13.4% is the least favorable economic prospect in more than a decade, according to the University of Michigan Survey of Consumers.
In fact, The Sentiment Index has only recorded larger losses in six other monthly surveys since 1978.
“Consumers’ extreme reactions were due to the surging Delta variant, higher inflation, slower wage growth and smaller declines in unemployment. The extraordinary fall-off in sentiment also reflects an emotional response, from dashed hopes that the pandemic would soon end and lives could return to normal,” said Richard Curtin, chief economist for Survey of Consumers.

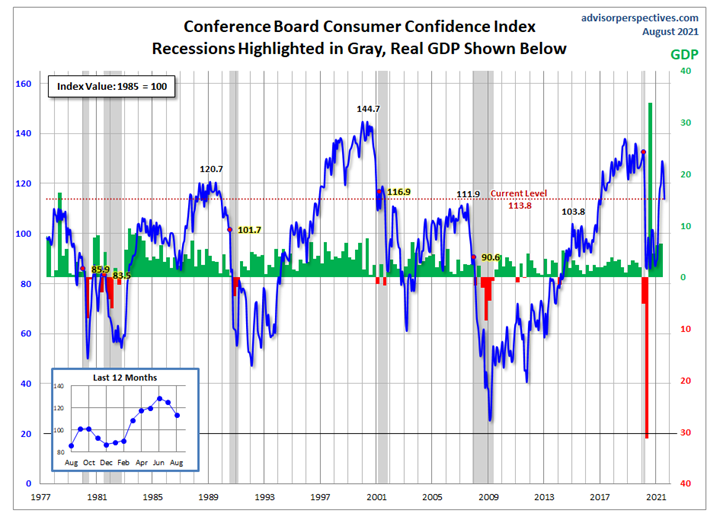
Jill Mislinski of Advisor Perspectives – a leading interactive publisher for Registered Investment Advisors (RIAs), wealth managers and financial advisors – put the recent consumer sentiment report into a larger historical context as a coincident indicator of the economy. “Toward this end, we have highlighted recessions and included GDP. The regression through the index data shows the long-term trend and highlights the extreme volatility of this indicator. Statisticians may assign little significance to a regression through this sort of data, but the slope resembles the regression trend for real GDP shown below, and it is a more revealing gauge of relative confidence than the 1985 level of 100 that the Conference Board cites as a point of reference,” she said.
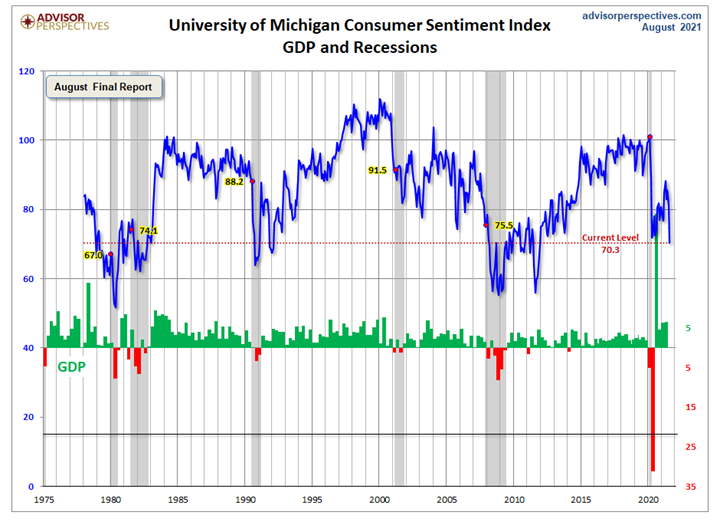
This chart provides additional perspective about consumer attitudes, according to Advisor Perspectives.
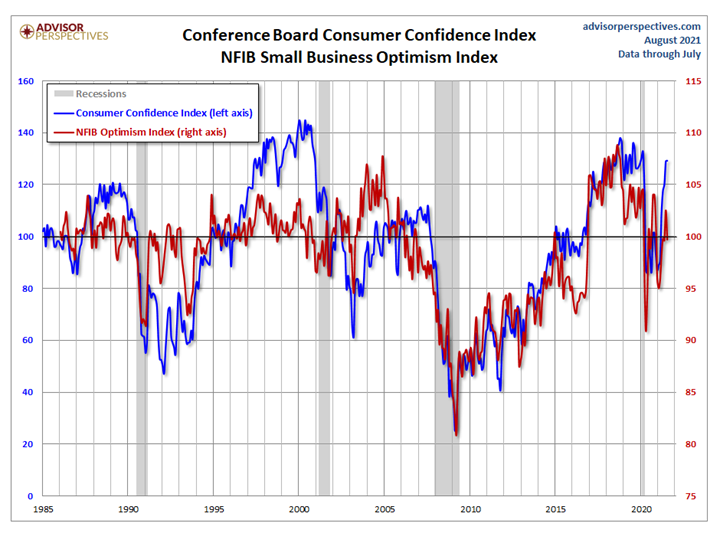
Presented above is the correlation between consumer confidence and small business sentiment, the latter by way of the National Federation of Independent Business (NFIB) Small Business Optimism Index. As the chart illustrates, the two have tracked one another quite closely since the onset of the Financial Crisis, although a spread appears infrequently, with the most recent spread showing up 2015 through present, explained Mislinski.
Consumer Spending
Consumer spending also decelerated in July, but the overall outlook is on track for a record year, according to Matthew Shay, president/CEO of National Retail Federation (NRF).
“Though the Delta variant is presenting health challenges, while supply chain disruptions along with unfilled job openings are presenting business challenges, the consumer and broader economy continue to display steady strength aided by advanced tax credit payments and strong gains in the labor market and personal incomes,” said Shay. “We remain optimistic that the strength of the American consumer and ingenuity of the retail industry will produce continued growth heading into the fall.”
Click here to review the latest report from NRF.
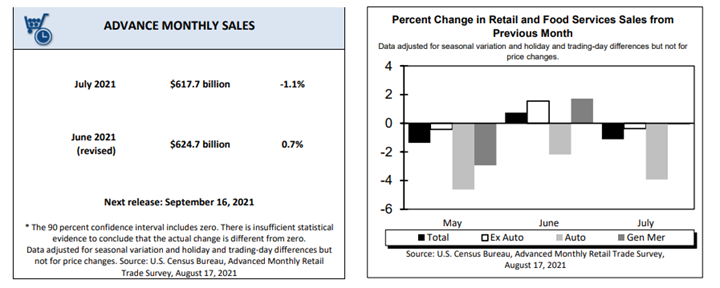
Advance estimates of U.S. retail and food services sales for July 2021 – adjusted for seasonal variation and holiday and trading-day differences, but not for price changes – were $617.7 billion, a decrease of 1.1% (±.5%) from the previous month, but 15.8% (±.7%) above July 2020. Total sales for the May 2021 through July 2021 period were up 20.6% (±.5%) from the same period a year ago. The May 2021 to June 2021 percent change was revised from up .6% (±.5%) to up .7% (±.2%). Retail trade sales were down 1.5% (±.5%) from June 2021, but up 13.3% (±.7%) above last year. Clothing and clothing accessories stores were up 43.4% (±2.8%) from July 2020, while food services and drinking places were up 38.4% (±3%) from last year.
Key Performance Indicators Report — September 2021
