

- KPI – September 2025: The Brief
- KPI – September 2025: State of Manufacturing
- KPI – September 2025: Consumer Trends
- KPI – September 2025: State of the Economy
- KPI – September 2025: Recent Vehicle Recalls
Global Light Vehicle Sales
In August, the global light vehicle (LV) selling rate was “broadly in line” with the previous month – registering over 94 million units per year. The market grew 4% year-over-year, as sales reached 7.2 million units globally. In addition, year-to-date sales currently stand at 59 million units, up 5% from the same period in 2024.

Trade tensions shifted from hot to simmering, as most key markets responded with growth in August. While Japan posted its second consecutive monthly decline, hindered by robust year-ago sales, the U.S. and Western Europe experienced modest year-over-year sales increases. China surfaced as the main driver of global sales growth in August – up 12.4% in volume.
“China was the only major market to deliver double-digit percentage growth, as a government-backed trade-in scheme, combined with a price war between manufacturers, boosted the market,” says David Oakley, manager of Americas vehicle sales forecasts at GlobalData.
Looking ahead, September sales are expected to increase 4.2% year-over-year. According to Oakley, China is expected to deliver more growth “given there are indications that the government will continue its support for the trade-in scheme, even as it looks to rein in manufacturers and push them toward more sustainable pricing.”
Europe, specifically the United Kingdom and Germany, is forecasted to achieve some year-over-year gains as well. Although, Oakley says, such increases are largely due to weak year-ago sales and favorable calendar effects, rather than market strength.
“Several recent developments point to a more positive outlook for the global auto market in the remainder of 2025. Though trade tensions remain, the situation has stabilized to some extent, compared with a constantly changing picture earlier in the year,” Oakley says. “Meanwhile, the ongoing government stimulus in China warrants a more optimistic forecast in the world’s largest light-vehicle market. We now see total 2025 global sales at 91.2 million units, up by 2.7% year-over-year.”
U.S. New Vehicle Market
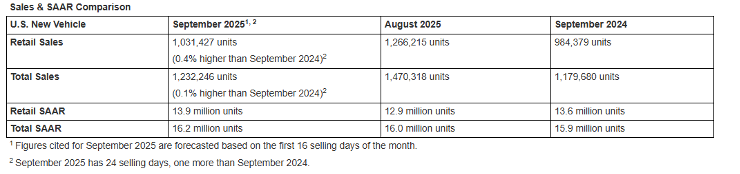
Total new vehicle sales for September 2025, including retail and non-retail transactions, are projected to reach 1,232,200 – a 0.1% year-over-year increase, according to a joint forecast from J.D. Power and GlobalData.
“In aggregate, September sales results point to another month of strong demand for new vehicles. However, as has been the case for the past few months, assessing the health of the industry requires a closer look at the underlying market dynamics,” says Thomas King, president of the data and analytics division at J.D. Power.
He says temporarily inflated demand for electric vehicles is the biggest driver of strong sales in September. The federal EV tax credit expires at the end of the month, which is causing many shoppers to accelerate their purchases. As a result, the EV share of retail sales is expected to reach a record 12.2% this month – up 2.6 percentage points from a year ago. On a volume basis, King says it equates to a 27.5% year-over-year increase in EV sales (selling-day adjusted). Conversely, “demand for non-EVs is muted,” with non-EV sales down 2.5% this month from a year ago.
“The second key driver is affordability,” King says. “Although, again, the EV dynamic means aggregate results need careful evaluation. In totality, average vehicle prices continue to rise, discounts remain low and monthly finance payments are at record highs – all of which affect the overall sales pace.”

Key Takeaways, Courtesy of J.D. Power:
- Retail buyers are on pace to spend $45 billion on new vehicles, up $3.5 billion year-over-year.
- Internal combustion engine (ICE) vehicles are projected to be 71.7% of new vehicle retail sales, a decrease of 4.9 percentage points from a year ago. Plug-in hybrid vehicles (PHEV), electric vehicles (EVs) and hybrid electric vehicles are expected to account for 2.6%, 12.2% and 12.4%, respectively, in new vehicle retail sales.
- Trucks/SUVs are predicted to be 82.1% of new vehicle retail sales, up 1.6 percentage points year-over-year.
- Leasing is expected to account for 23.9% of sales this month, up 0.6 percentage points from a year ago.
- The average new vehicle retail transaction price should reach $45,795, up $1,310 from last year.
- Average incentive spending per unit on trucks/SUVs is approximately $3,244, down $54 from a year ago, while the average spending on cars is expected to be $2,492, up $167 from a year ago.
- Average monthly finance payments are on pace to hit $756, up $21 year-over-year. The average interest rate for new-vehicle loans is expected to be 6.51%, down 0.25 percentage points from a year ago.
- Total retailer profit per unit, which includes vehicle gross plus finance and insurance income, is estimated to be $2,240, up $12 year-over-year and up $79 from the year prior. Total aggregate retailer profit from new-vehicle sales is projected to hit $2.2 billion, up 6% year-over-year.
- Fleet sales are on pace to total 200,819 units in September, down 1.5% year-over-year. Fleet volume is expected to account for 16.3% of total light-vehicle sales, down 0.3 percentage points from a year ago.
“Looking to October, the EV dynamic will continue to heavily influence results, but the effect on sales will shift from positive to negative. A very significant decline in EV sales is expected for October, reflecting both the effect of the federal EV tax credit expiring and the start of payback from all the EV purchases that were accelerated into the summer. The net effect will be heavily influenced by the extent to which manufacturers attempt to offset the loss of the federal EV tax credit, if at all,” King explains.
“October sales will also be affected by manufacturers’ pricing and incentive decisions on non-EVs. The current low level of non-EV discounting provides plenty of potential for manufacturers to escalate incentives to bolster demand. However, tariff-related cost pressure remains significant, meaning the current pricing and incentive environment is likely to persist for much of Q4,” he continues.
U.S. Used Market
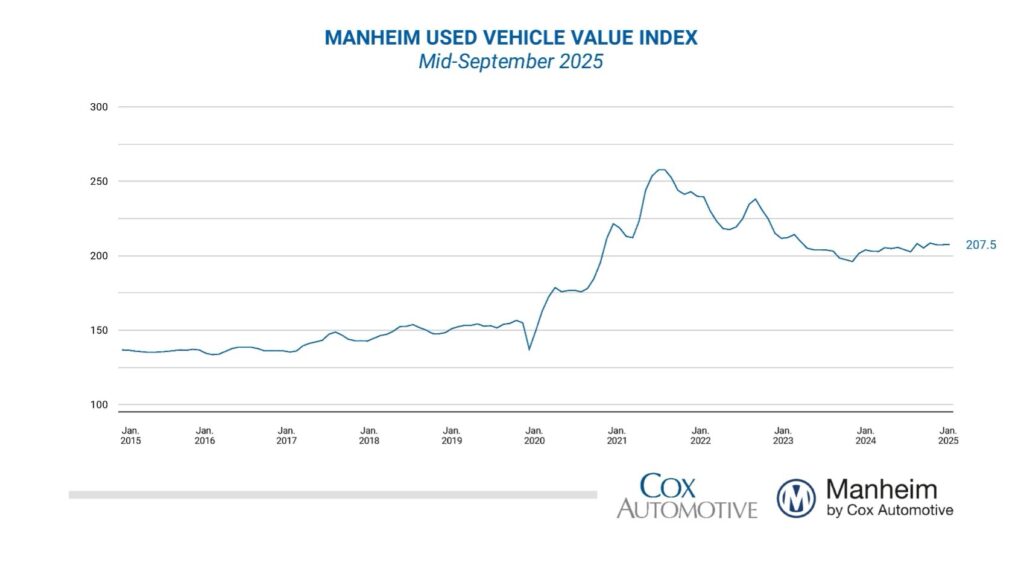
Wholesale used-vehicle prices (on a mix-, mileage- and seasonally adjusted basis) increased slightly from August during the first 15 days of September. The mid-month Manheim Used Vehicle Value Index increased from 207.4 to 207.5 – a negligible month-over-month change of 0.0% – but was 2.2% higher than the full month of September 2024.
“Wholesale values are continuing to buck traditional trends as they have for most of 2025, as prices have yet to return to normal depreciation levels,” says Jeremy Robb, deputy chief economist at Cox Automotive. “We are continuing to see elevated new and used retail sales trends in the first part of September, and that is keeping retail days’ supply relatively tighter, pushing buyers through the doors at Manheim. As we approach the end of September, when tax incentives on EVs end, we are seeing demand trends that are keeping used EV sales strong and values even stronger, even as EVs rise in sales mix at Manheim.
“The automotive market continues to show resiliency overall, both at the retail and wholesale level, as they are tied so closely to each other,” he continues.

Segment results for seasonally adjusted, year-over-year prices were “somewhat mixed” during the first half of September, according to Manheim. Compared to the industry’s year-over-year increase of 2.2%, luxury, SUVs, trucks and mid-size cars were up 2.1%, 0.9%, 0.5% and 0.3%, respectively. The compact car segment declined the most, down 4.6% year-over-year. Electric vehicles (EVs) continue to post strong gains, up 5.5% year-over-year, while the non-EV segment increased by 1.4%.