- KPI – October 2026: State of Manufacturing
- KPI – October 2026: State of Business – Automotive Industry
- KPI – October 2026: State of the Economy
- KPI – October 2026: Consumer Trends
- KPI – October 2026: Recent Vehicle Recalls
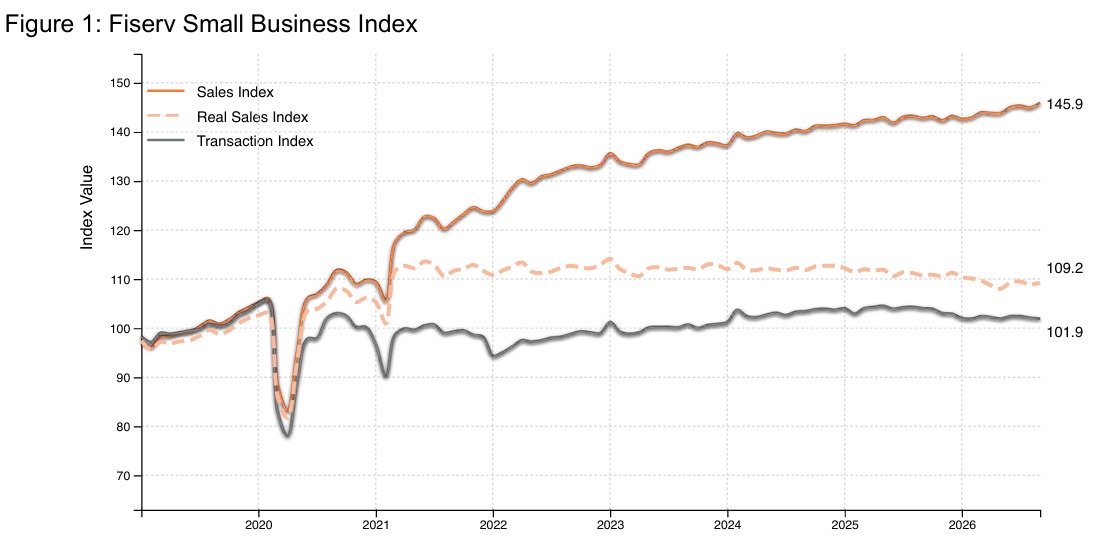
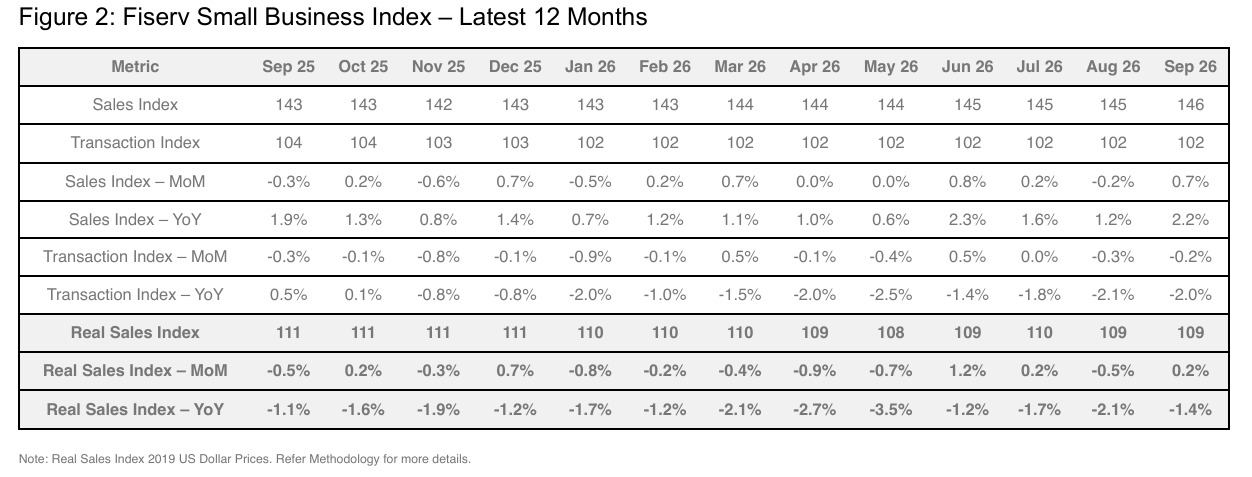
In September, the national Fiserv Small Business Index and Fiserv Small Business Transaction Index reflected mixed demand. The Fiserv Small Business Index, attributed to small business sales, reached 145.9—growing 2.2% year-over-year and 0.7% month-over-month.
Meanwhile, the Fiserv Small Business Transaction Index recorded 101.9, declining 2% year-over-year and 0.2% month-over-month. The Real Fiserv Small Business Index, adjusted for inflation, reached 109.2 in September—a year-over-year decline of 1.4% but a month-over-month increase of 0.2%.
“September’s results reflect the resilience of consumers and small businesses, but also the trade-offs households are making as they manage higher costs,” says Prasanna Dhore, chief data officer at Fiserv. “Spending remains deliberate, with consumers shifting dollars among categories to meet immediate needs while pulling back elsewhere.”
Key Takeaways, Courtesy of the Fiserv Small Business Index:
- Higher prices again did the heavy lifting: Average tickets were up 4.2% year-over-year, while total foot traffic (transactions) fell for the 11th straight month (down 2% year-over-year and 0.2% month-over-month). As families shifted from summer to school-year routines, spending moved toward retail and away from dining out.
- Retail rebounded on back-to-school traffic: Total Retail sales rose 3% year-over-year and 1.3% month-over-month, matching June’s high. Transactions increased 2.4% year-over-year, while average tickets edged up 0.5%. Sporting Goods, Hobby and Miscellaneous Retailers gained 5.5% on 6.6% increased transaction growth, led by a 10.4% increase among Sporting Goods Retailers. Clothing foot traffic rose 6.1%, even as average tickets fell 4.7% year-over-year.
- Back-to-school needs reshuffled family budgets: Discretionary sales rose 2% year-over-year, up from 0.9% in August and approaching a 2.4% increase in essentials. However, discretionary transactions fell 2.2% year-over-year, suggesting families shifted spending toward clothing, shoes and school supplies and away from dining and services. Goods sales increased 2.9% on 2.2% increased transaction growth, while average tickets edged up 0.7%. Services grew 1.9% on higher prices, with average tickets up 5.4% and foot traffic down 3.5%, its steepest decline in more than a year.
- Restaurants lost more ground: Food Services and Drinking Places sales fell 1% year-over-year and 0.2% month-over-month as transactions declined 3.9%, offsetting a 2.8% increase in average tickets. Limited-Service Restaurants again posted the steepest declines, with sales down 4% and transactions down 5.6% year-over-year. Full-Service Restaurant sales edged up 0.8%, while Drinking Places rose 5.3% year-over-year.
- Gasoline surged and grocery rebounded: Gas Station sales grew 21.1% year-over-year and 6% month-over-month as average tickets rose 20.9% and transactions remained nearly flat at 0.2%. Adjusted for inflation, sales fell 5%, indicating drivers paid more but did not buy more. Grocery sales also rebounded: Food and Beverage Retailer sales rose 1.9% year-over-year as transactions increased 1.5%, likely reflecting back-to-school restocking.
In September, the NFIB Small Business Optimism Index declined 0.8 points to 97.9, one-tenth of a point below the 52-year average of 98.0. The Uncertainty Index rose a single point to 90, remaining well above the historical average of 68. Labor quality or availability remained the top reported issue for the third consecutive month.
“Small business optimism stayed near the long-term average in September, as Main Street owners remain uncertain about business conditions,” says Bill Dunkelberg, NFIB chief economist. “Small business owners are proceeding with caution as they interpret how rising costs, interest rates and the difficulty in finding qualified employees are impacting their business.”
Important Takeaways, Courtesy of NFIB:
- Reports of “labor quality or availability” as owners’ single most important problem rose three points in September to 26%, making it the top reported issue for the third consecutive month.
- The second top issue was inflation, with 20% of owners reporting it as their single most important problem, up four points from August. September’s reading remains elevated, with a historical average of 7%.
- Expectations for better business conditions worsened for the second consecutive month. A net 6% (seasonally adjusted) of owners expect better conditions in the next six months, down four points from August but remaining above average.
- Only 7% (seasonally adjusted) of owners reported that it is a good time to expand their business, down five points from August.
- Small business owners’ self-evaluation of the health of their business shifted negatively in September, with substantially more owners reporting their business “fair” (35%, up seven points) rather than “good” (48%, down nine points).
- The net percent of owners reporting inventory gains fell four points to a net negative 10% (seasonally adjusted), the lowest reading since September 2024. A net 2% (seasonally adjusted) plan inventory investment in the coming months, up one point from August and the highest reading since December 2024.
- A net 8% of owners reported paying a higher interest rate on their most recent loan, up four points from August and the highest level since June 2025. The average interest rate on short-maturity loans was 8.2% in September, up 0.7 points from August and close to the historical average of 8.3%.
- Poor sales and taxes are tied as the third most important problem among small business owners in September. Eleven percent of small business owners reported poor sales as their top issue, up one point from August and the third consecutive month of increase. The percent of small business owners reporting taxes as their single most important problem decreased five points from August to 11%.
Key Performance Indicator Report Overview
Professionals in the automotive, RV and powersports industries remain steadfast in their efforts to evolve their business models and grow their brands in the face of adversity. As such, the monthly Key Performance Indicator Report serves as an objective wellness check on the overall health of our nation, from the state of manufacturing and vehicle sales to current economic conditions and consumer trends. Below are a few key data points explained in further detail throughout the report.
Key Takeaways:
- Economic activity in the manufacturing sector expanded for the ninth consecutive month during September, according to the nation’s supply executives in the latest ISM Manufacturing PMI Report. The Manufacturing PMI registered 54.5%, 0.1 percentage point below the August figure of 54.6%. The overall economy continued in expansion for the 23rd month in a row.
- In September, the global Light Vehicle (LV) selling rate fell to 89 million units per year—bringing the year-to-date (YTD) average selling rate to 88 million units per year in 2026, 4.4% lower than the full-year 2025 result.
- Total new-vehicle sales for October 2026, including retail and non-retail transactions, are projected to reach 1,327,100—a 0.2% year-over-year increase, according to a joint forecast from J.D. Power and GlobalData.
- The Manheim Used Vehicle Value Index (MUVVI) rose to 207.4, reflecting a 0.7% increase in wholesale used-vehicle prices (adjusted for mix, mileage and seasonality) during the first 15 days of October compared to September. The Manheim index is now higher by 2.2% compared to October 2025, rebounding after the softening seen in the third quarter of the year.
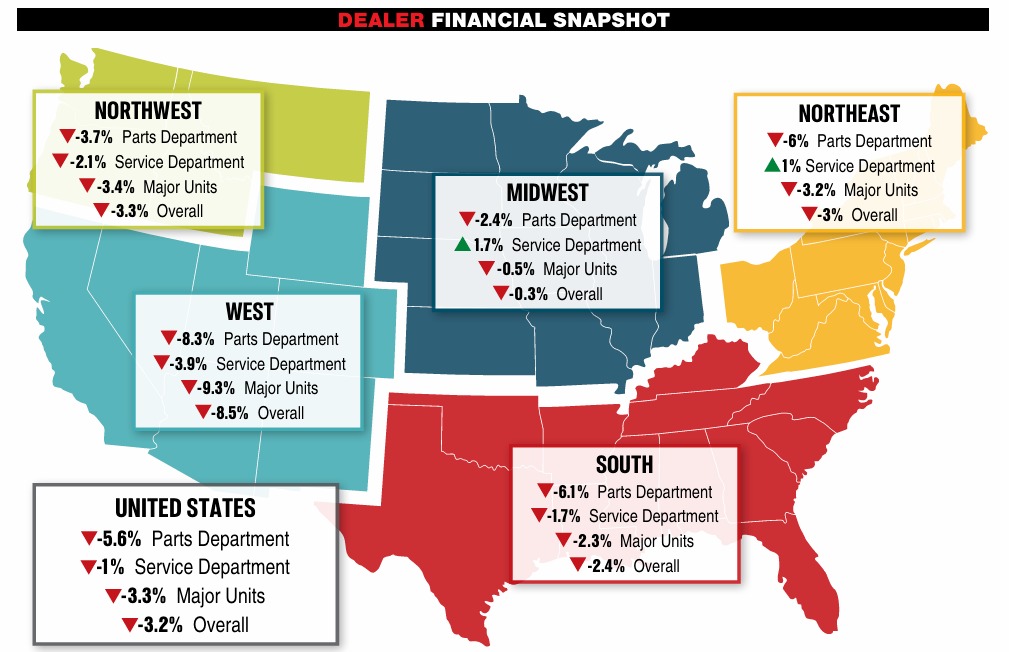
- Powersports Business says dealers across the country reported a slight decline of 3.2% in combined same-store sales compared to the same month last year, according to composite data from more than 1,700 dealerships in the U.S. that utilize CDK Lightspeed DMS. On average, dealerships were down 3.3% in major units, 5.6% in the parts department and 1% in service.