
KPI – May 2024: Recent Vehicle Recalls
KPI – May 2024: State of Manufacturing
KPI – May 2024: State of Business – Automotive Industry
KPI – May 2024: Consumer Trends
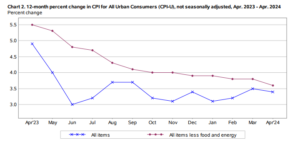
In April, the Consumer Price Index for All Urban Consumers (CPI-U) increased 0.3% on a seasonally-adjusted basis, after rising 0.4% in March, according to the U.S. Bureau of Labor Statistics. Over the last 12 months, the all-items index increased 3.4% before seasonal adjustment.
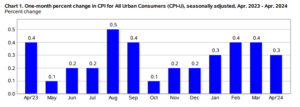

Important Takeaways, Courtesy of the U.S. Bureau of Labor Statistics:
- The indexes for shelter and gasoline rose. These two indexes combined contributed to over 70% of the monthly increase in the all-items index.
- Indexes on the rise include shelter, motor vehicle insurance, medical care, apparel and personal care. The indexes for used cars and trucks, household furnishings and operations and new vehicles were among those to decrease month-over-month.
- The all-items index rose 3.4% year-over-year. The all items less food and energy index rose 3.6% during the time period. The energy index increased 2.6%, while food increased 2.2%.

Employment
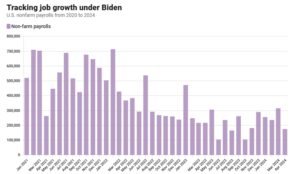
Total nonfarm payroll employment increased by 175,000 in April – significantly below both the Dow Jones estimate and the upwardly revised March employment report. The unemployment rate and number of unemployed persons inched up to 3.9% and 6.5 million people, respectively. Meanwhile, the labor force participation and long-term unemployed (those jobless for 27 weeks or more) rates were relatively unchanged at 62.7% and 19.6%, respectively, according to the U.S. Bureau of Labor Statistics. Data shows the jobless rate tied for the highest level since January 2022. In addition, discouraged workers and those holding part-time jobs for economic reasons also edged up to 7.4%, its highest level since November 2021.
Disappointing results extend to the seasonally-adjusted real average hourly earnings for all employees, which decreased 0.2% from March to April. Real average weekly earnings decreased 0.4% month-over-month due to the change in real average hourly earnings combined with a 0.3% decrease in the average workweek.
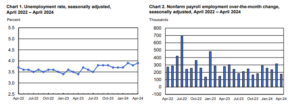

Caption: The change in total nonfarm payroll employment for February was revised down by 34,000, from +270,000 to +236,000, and the change for March was revised up by 12,000, from +303,000 to +315,000. With these revisions, employment in February and March combined is 22,000 lower than previously reported.
“The spring flowers may have been blooming in April, but the labor market showed modest signs of wilting,” says Jason Pride, chief of investment strategy and research at Glenmede.
While the lackluster report, with nearly half of its growth in health care and social assistance, signifies “a job market beginning to sputter,” economic experts agree it also may boost the odds of rate cuts sooner rather than later.
“Following a steady stream of sticky inflation data in recent months, this much-weaker-than-expected jobs report had to bring smiles to the faces of the Fed board,” says Chris Larkin, managing director of trading and investing at E*Trade. “It may not put a June rate cut back on the table, but unless it turns out to be an anomaly, it will increase the odds that the Fed will be able to get in at least one cut this year.”

By Demographic
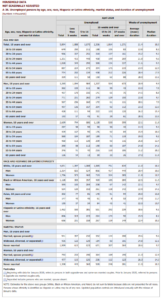
This month, unemployment rates among the major worker groups: adult women – 3.5%, adult men 3.6%, teenagers – 11.7%, Asians 2.8%, Whites – 3.5%, Hispanics 4.8% and Blacks – 5.6%.
Last month, unemployment rates among the major worker groups: adult women – 3.6%, adult men 3.3%, teenagers – 12.6%, Asians 2.5%, Whites – 3.4%, Hispanics 4.5% and Blacks – 6.4%.
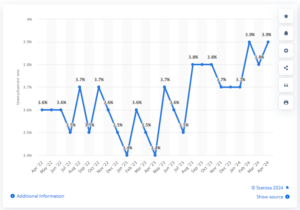

Caption: In April 2024, the U.S. unemployment rate was at 3.9%. Seasonal adjustment is a statistical method of removing the seasonal component of a time series that is used when analyzing non-seasonal trends.

By Industry
While the Employment Trends Index™ has been on a downward trajectory since its peak in March 2022, it remains historically elevated and suggests aggregate job losses are less likely than a slowdown in employment growth.
“April payrolls data showed an increase in employment (+175,000) for the 39th consecutive month.
However, between the decrease in the topline number and the narrowing of job gains across sectors relative to recent months, the labor market is beginning to show signs of cooling following a period of very strong growth since the pandemic recession,” says Will Baltrus, associate economist at The Conference Board. “Nonetheless, it is unlikely that substantial job losses will occur over the coming months, as employers are still facing labor shortages.”
Despite labor shortages, Baltrus says many firms are not looking to hire, but also are not letting workers go – a dynamic known as labor hoarding.
“Shortages and hoarding are keeping the unemployment rate low and wages sticky. Sticky wages along with elevated interest rates are raising the cost of doing business for many companies. These factors may play into employer decisions to hire more workers, but we posit that slowing consumer demand for goods and services ahead will be the primary driver of slower growth and an uptick in the unemployment rate ahead,” Baltrus explains.
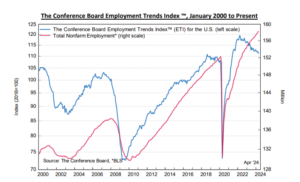

Caption: The Conference Board Employment Trends Index™ (ETI) decreased to 111.25 in April, from a
downwardly revised 112.16 in March. The ETI™ is a leading composite index for employment. When the Index increases, employment is likely to grow as well, and vice versa. Turning points in the Index indicate that a change in the trend of job gains or losses is about to occur in the coming months.
Important Takeaways, Courtesy of the U.S. Bureau of Labor Statistics:
- Health care added 56,000 jobs in April, in line with the 12-month average monthly gain of 63,000. Employment continued to increase in ambulatory health care services (+33,000), hospitals (+14,000) and nursing and residential care facilities (+9,000).
- Employment in social assistance increased by 31,000, led by a gain in individual and family services (+23,000). Social assistance added an average of 21,000 jobs per month over the prior 12 months.
- Transportation and warehousing added 22,000 jobs, with gains in couriers and messengers (+8,000) and warehousing and storage (+8,000). Over the past 12 months, employment in transportation and warehousing showed little net change.
- Employment in retail trade continued to trend up in April (+20,000). Over the prior 12 months, the industry added an average of 7,000 jobs per month. In April, employment increased in general merchandise retailers (+10,000), building material and garden equipment and supplies dealers (+7,000), as well as health and personal care retailers (+5,000). Electronics and appliance retailers lost 3,000 jobs.
- Construction employment changed little in April (+9,000), following an increase of 40,000 in March. Over the prior 12 months, construction added an average of 22,000 jobs per month.
- Employment in government changed little in April (+8,000). Over the prior 12 months, government added an average of 55,000 jobs per month. In April, local government employment was unchanged, following an increase of 51,000 in March.