

- KPI – February 2025: The Brief
- KPI – February 2025: State of Manufacturing
- KPI – February 2025: Consumer Trends
- KPI – February 2025: State of the Economy
- KPI – February 2025: Recent Vehicle Recalls
U.S. NEW VEHICLE SALES
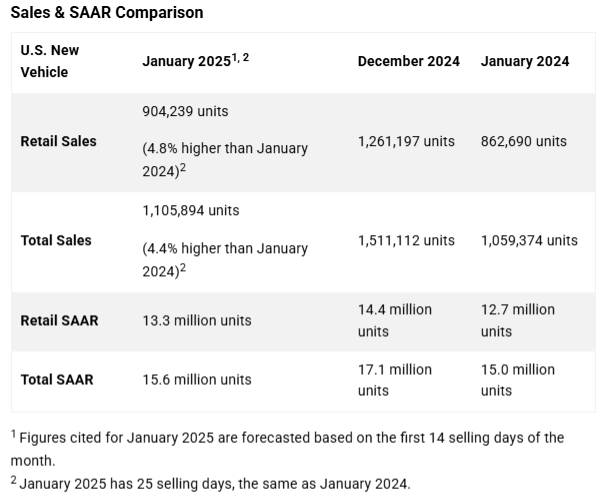
Total new vehicle sales for January 2025, including retail and non-retail transactions, are projected to reach 1,105,900 – a 4.4% year-over-year increase, according to a joint forecast from J.D. Power and GlobalData.
“January’s SAAR forecast of 15.6 million is up 0.6 million from last January; however, it is considerably lower than December’s 17.1 million SAAR. While the decline from the December sales pace is notable, it is important to recognize that January is typically the lowest sales volume month of the year. As such, the January sales pace is generally not indicative of the long-term outlook for the industry,” says Thomas King, president of the data and analytics division at J.D. Power.

Takeaways, courtesy of JD Power:
- Retail buyers are on pace to spend $56.4 billion on new vehicles, up $4.2 billion year over year.
- Trucks/SUVs are expected to account for 81.5% of new vehicle retail sales in January.
- The average new vehicle retail transaction price is expected to reach $44,636 – down $238 year over year.
- Average incentive spending per unit is expected to reach $3,226 – up $730 year over year.
- Total retailer profit per unit, which includes vehicles gross plus finance and insurance income, is estimated to be $2,272 – down 13.5% year over year.
- Fleet sales are on pace to total 201,655 units, up 2.5% year over year. Fleet volume is expected to account for 18.2% of total light vehicle sales, down 0.3 percentage points from a year ago.
- Average interest rates for new vehicle loans are expected to be 6.7%, down 16 basis points from a year ago.
“The market dynamics in January are consistent with those observed throughout 2024: rising sales enabled by rising discounts from manufacturers and retailers. This dynamic is expected to persist throughout 2025. Several factors could disrupt this dynamic, including the potential for changes to federal electric vehicle tax credits, fuel economy standards and new import tariffs,” King says. “However, demand for vehicles remains strong for now and the overall health of the new vehicle market is good, as evidenced by the simple fact that consumers will spend more money on new vehicles this January than ever before.”

U.S. USED MARKET
Wholesale used vehicle prices (on a mix-, mileage- and seasonally adjusted basis) dropped from January in the first 15 days of February. The mid-month Manheim Used Vehicle Value Index fell to 203.3, posting a decline of 0.2% from the full month of February 2024.
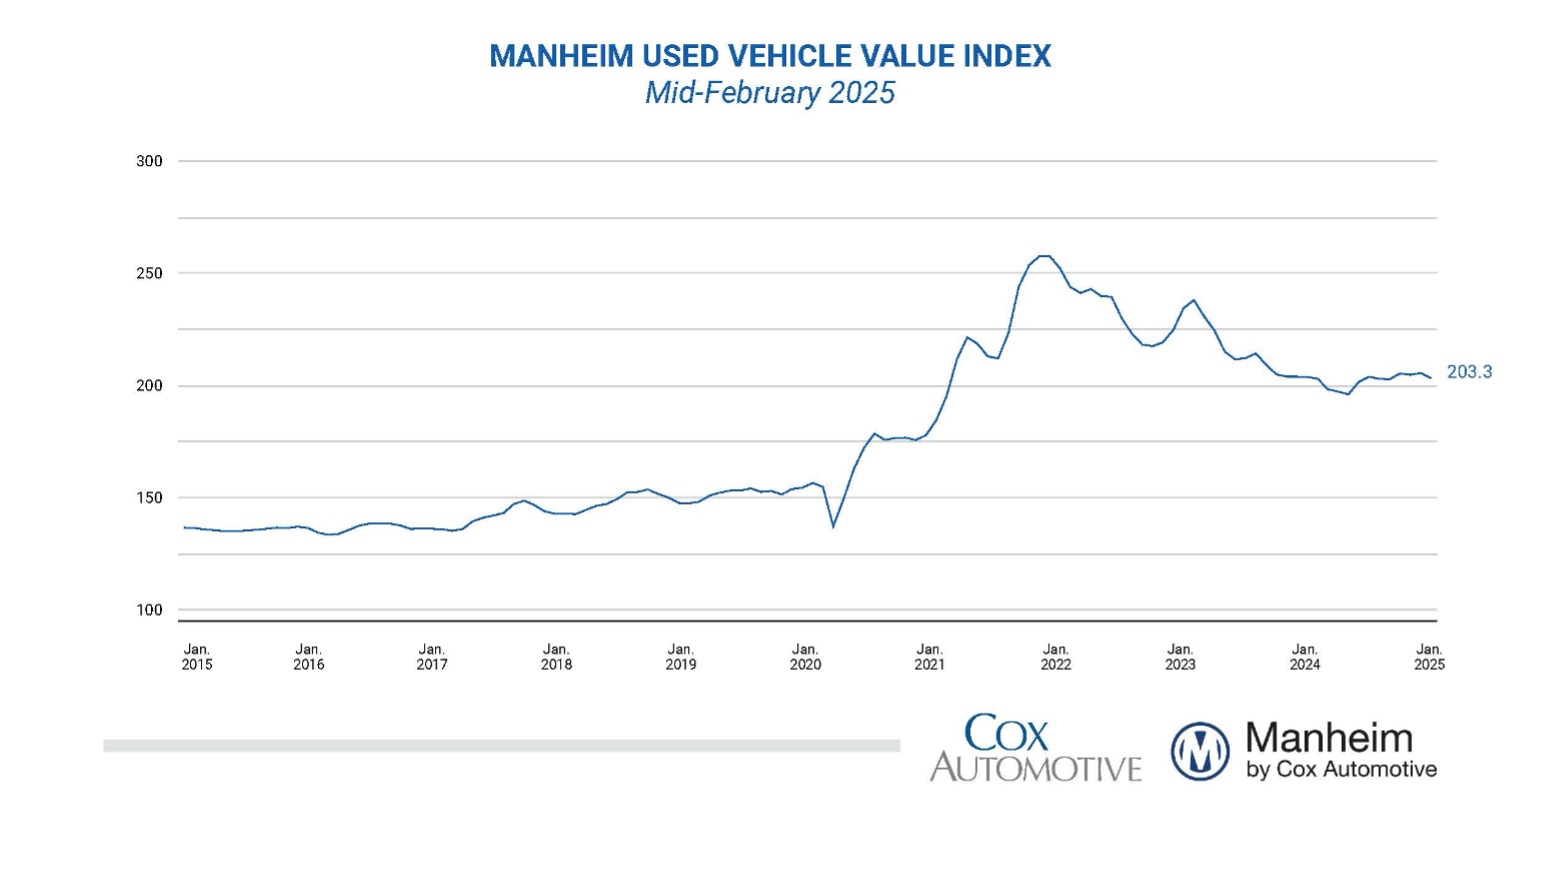

According to Manheim, major market segments posted mixed results for seasonally adjusted prices year over year during the first half of February.
The luxury segment performed best year over year, up 0.4%. Meanwhile, SUVs, pickups, mid-size and compact cars were down 0.2%, 1%, 3.1% and 4.7%, respectively. On a month-over-month basis, pickups and mid-size cars were down the least, at 0.3% and 0.7%, respectively, while SUVs, luxury and compact cars posted the highest declines at 1.1%, 1.3% and 1.5%, respectively.
Data shows electric vehicles (EVs) continue to exhibit the highest depreciation levels. EVs were down 6.4% year over year, while the non-EV segment slowed by 0.9%.